What is a Swimlane Diagram?

Summary
In this guide, you will learn:
What a swimlane diagram is
Key components of swimlane diagrams
How swimlane diagrams illustrate work flow
When and why to use swimlane diagrams
Differences between horizontal and vertical swimlanes
Step-by-step instructions on how to create a swimlane diagram
Try Miro now
Join thousands of teams using Miro to do their best work yet.
Unpacking Swimlane Diagrams
Suppose you’re building a new website for a company. The designer creates a wireframe that everyone approves. The developer starts programming the backend. The content team starts the editorial calendar. All seems well. But two months into the project, you realize that both the designer and the content team are writing user interface text. You need a swimlane diagram to show who does what and when in your project.
In this article, you’ll learn what a swimlane diagram is, tips for using one, and a swimlane diagram template to help get you started.

What is a swimlane diagram?
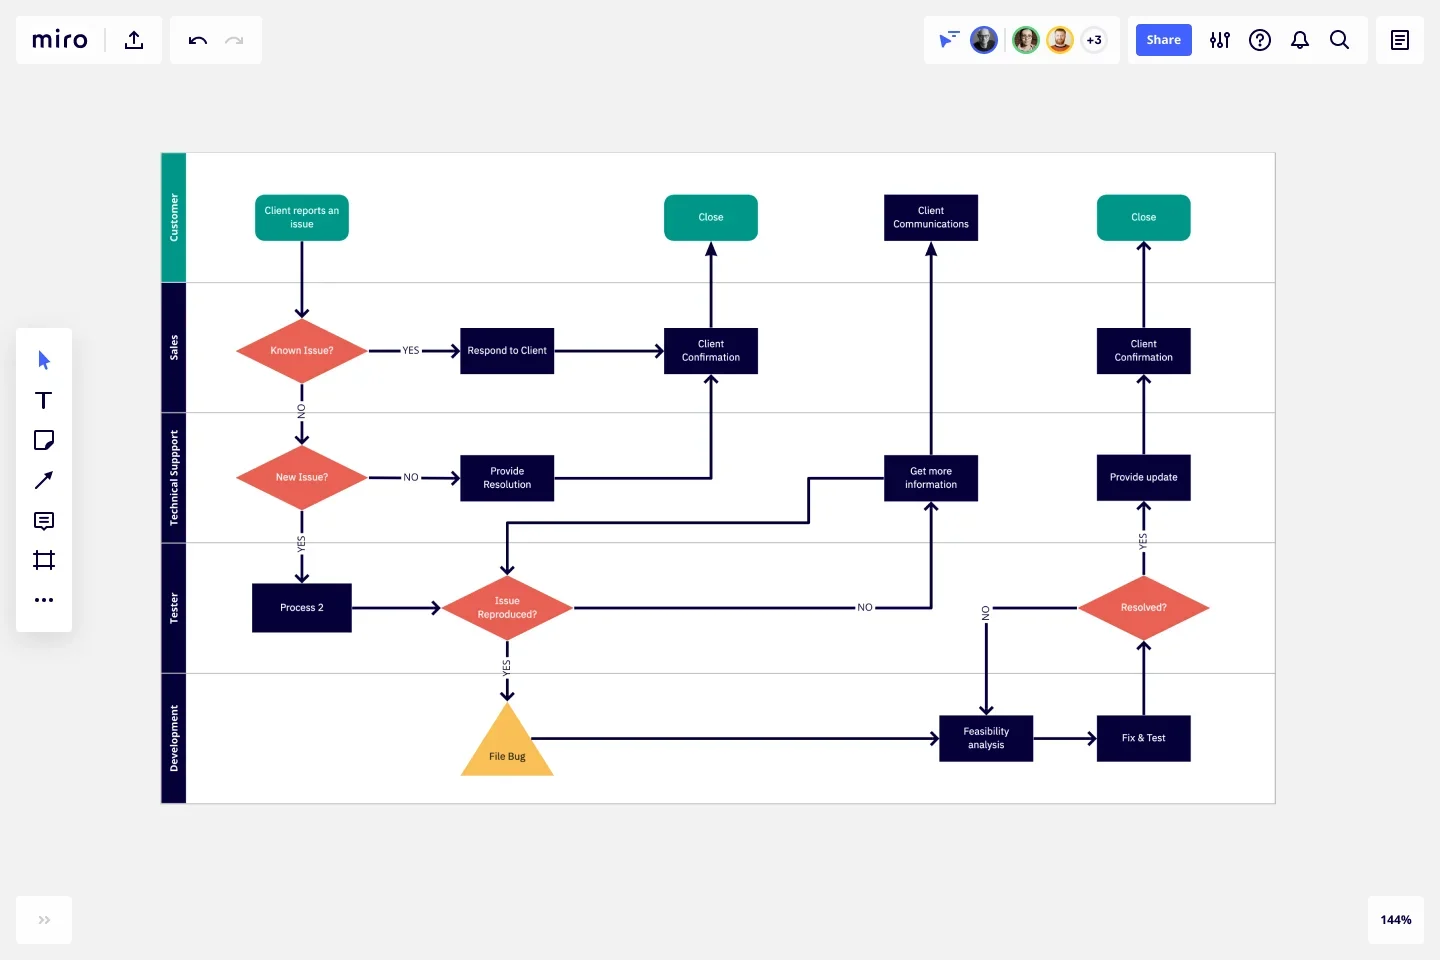
A swimlane diagram is a graphical representation of who does what and when in a process. A swimlane diagram uses the metaphor of lanes in a pool that extend horizontally or vertically to indicate ownership of workflow tasks. Swimlane diagrams can uncover duplicated efforts, redundancies, inefficiencies, and bottlenecks.
Lanes in a swimlane diagram can represent people, but they can also represent work groups, departments, or even tools and other processes. These parties can be internal or external.
A swimlane diagram illustrates who is responsible for each step in a process. It also describes how these steps relate to different actions and actors. As in a flowchart or workflow diagram, shapes represent steps and handoffs between team members or other actors in a process. Arrows between process steps show how information flows and transfers from one stage to another.
Although people commonly use the term swimlane diagram, these diagrams have different names, including cross-functional flowcharts, Rummler-Brache diagrams, or swimlane process maps.
What are the differences between swimlane diagrams and flowcharts?
A swimlane diagram is a type of flowchart. Both flowcharts and swimlane diagrams describe activities in a process, the inputs and outputs, and decision paths (or communication loops.) However, while a flowchart shows only activities, a swimlane diagram adds what person, role, entity, or process performs the actions.
What are swimming pools?
Swimlane diagrams can take up a lot of space and become messy if there are many participants. One way to bring order to a swimlane diagram chaos is through pools. Swimming pools contain more than one lane. When diagramming an entire process in an organization, a pool may represent a process, and the lanes represent the departments or roles performing activities.
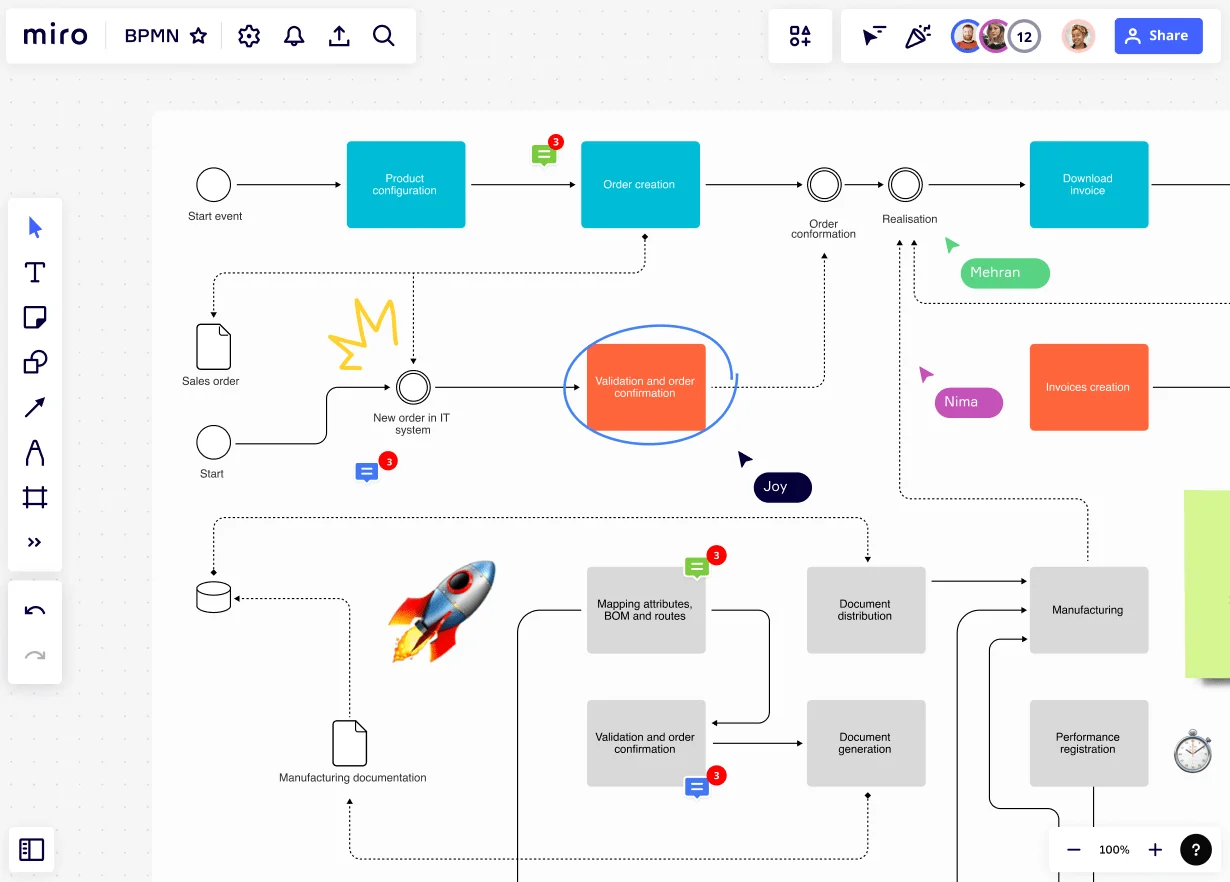
Swimlanes and pools feature prominently in business process modeling notation (BPMN) and its software variant, unified modeling language (UML). In BPMN, cross-functional flow diagrams map processes that include multiple departments. In UML, these diagrams showcase activities managed in different areas.

What are the benefits of a swimlane diagram?
Here are the main benefits of mapping processes with swimlane diagrams:
Visualize responsibilities
By dividing the diagram into lanes, swimlane diagrams clearly indicate which roles or departments are responsible for specific tasks or activities. This visual representation helps to clarify roles and responsibilities, reducing confusion and improving accountability.
Improve clarity and understanding
By providing a clear and concise representation of the process flow, swimlane diagrams make it easier for stakeholders to understand how different roles, departments, or individuals contribute to the overall process. It helps to identify dependencies, handoffs, and potential bottlenecks.
Streamline processes
Analyzing swimlane diagrams can reveal inefficiencies, redundancies, or gaps in the process flow. Identifying such areas for improvement becomes easier as the diagram clearly shows where delays or issues might occur. It serves as a basis for process optimization and streamlining efforts.
Documentation and training
Swimlane diagrams serve as valuable documentation of processes within an organization. They can be used for onboarding new employees, training purposes, or as a reference point for process-related discussions and documentation updates.
Swimlane diagram example
The key purpose of swimlane diagrams is to understand who is responsible for completing activities in processes. Other visual process flow diagrams such as timelines, Gantt charts, roadmaps, and Kanban boards can all include swimlanes to show task and process owners.

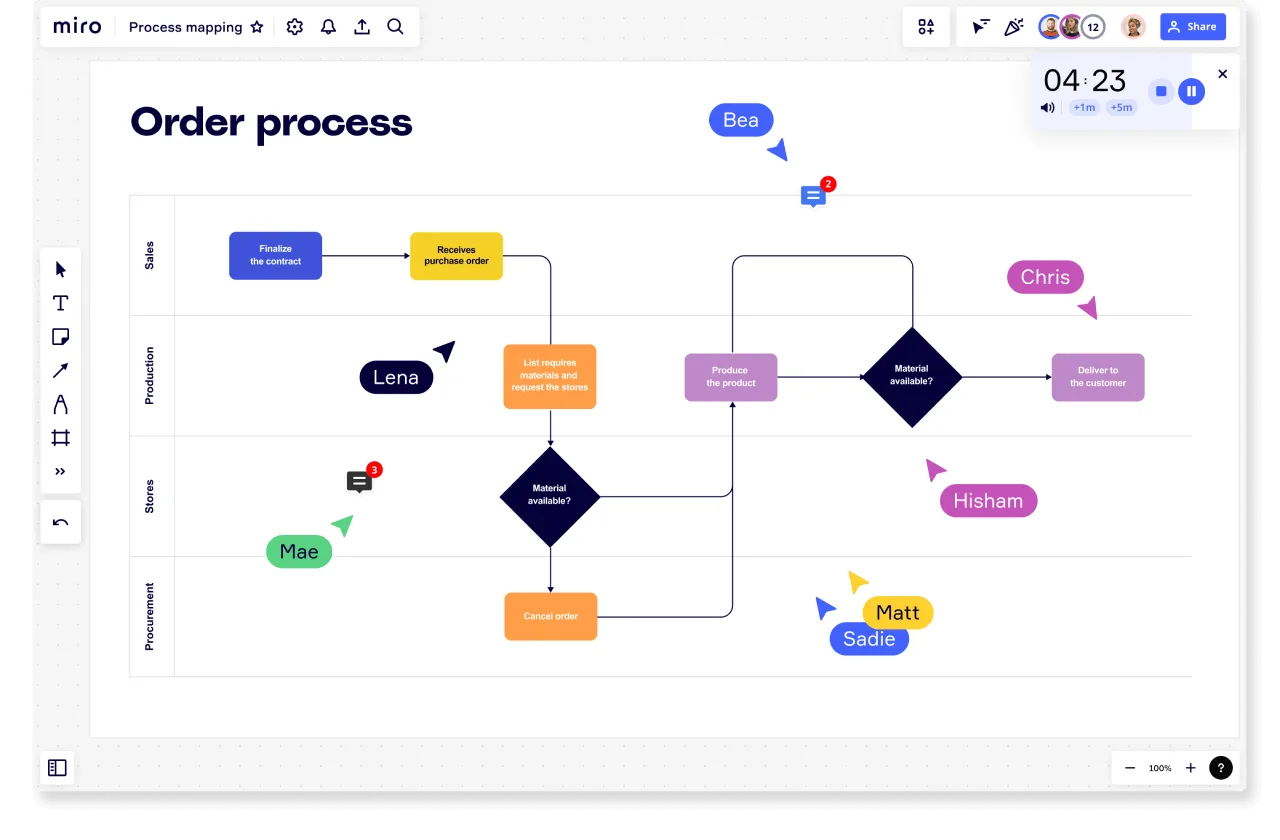
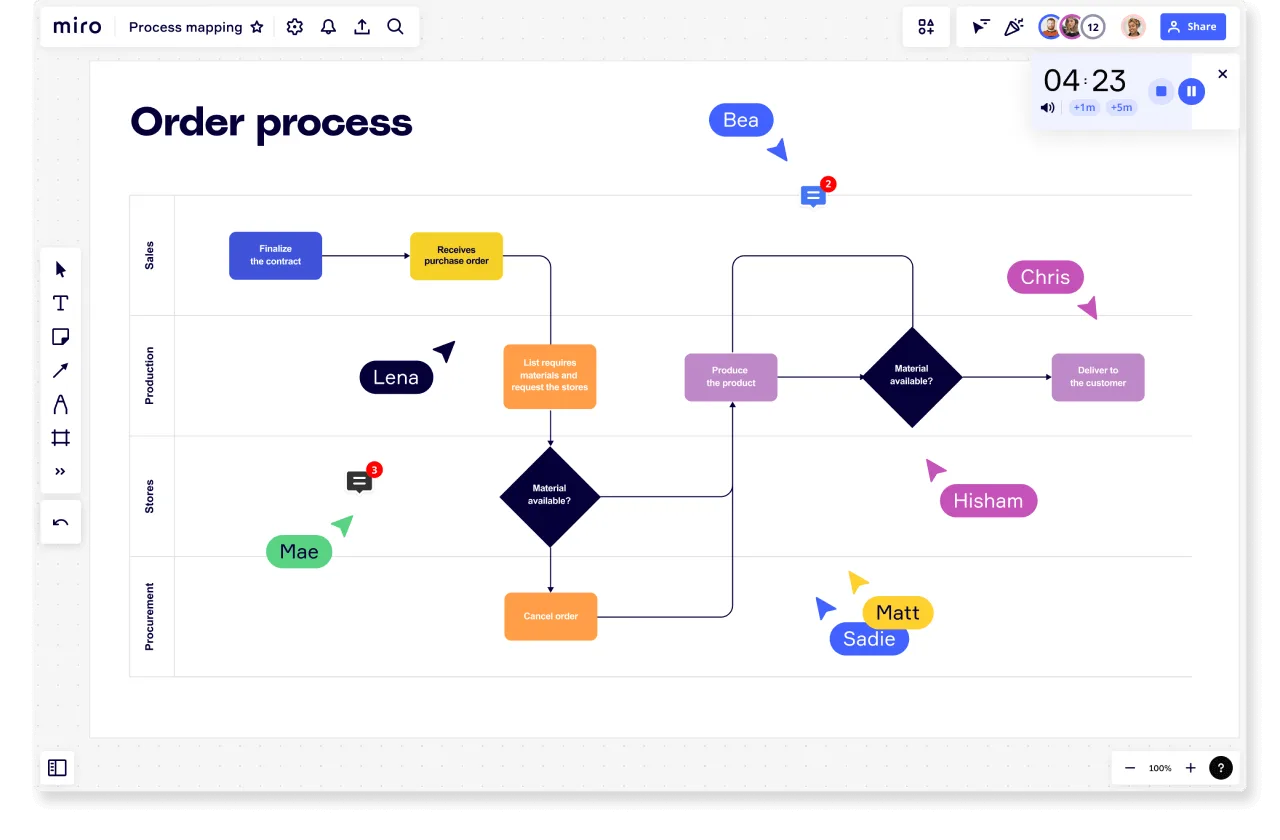
Let’s look at our example of a team mapping the process of fulfilling an order. In the diagram, each swimlane corresponds to a department involved in the fulfillment in some critical way.
Sales: First, the sales team finalizes the contract and submits the purchase order.
Production: Next, the production team lists the materials required to fulfill the order.
Store: The store or warehouse then assesses if the required materials are available. If they are not, the Procurement team is informed and may have to cancel the order. If the materials are available, the Production team gets started making the product according to the customer's specifications.
With each department's role mapped out, the sequence of activities and the responsibilities within each role is clearly understood. This allows for better collaboration and communication between the different departments.
Characteristics of swimlane diagrams
Although swimlane diagrams vary from person to person, some conventions do exist which add clarity to drawings and simplify the creation process. Formal diagrams often use standard flowchart symbols.
The swimlane shapes you use also depend on whether your diagram must conform to any rules or standards, such as when you must use BPMN for diagrams. The following are the standard symbols used to represent process events.
Labels
Clearly label each element so there’s no confusion about what is being represented.
Start and end points
Indicate the start and end of the process. Formal maps use a round-cornered rectangle.
Decision point
This represents a question to be answered or a choice to be made. A diamond shape indicates a decision point.
Action or task
A rectangle depicts actions, activities, or tasks.
Input or output
Includes anything that enters or results from the process and can be information, data, or the result of another process. A parallelogram represents inputs and outputs.
Connector
Represented by a small circle, connectors show a link to another diagram and, thus, another process.
Document
A rectangle with an undulating bottom border indicates a document required by the process.
Straight arrow
Indicates a physical handoff of documents or items.
Jagged arrow
Indicates an electronic handoff of a deliverable.
Object on a boundary link
Activities or tasks shared by actors sit on swimlane boundary lines.
How to create a swimlane diagram
A helpful swimlane diagram benefits from reflection before you ever draw the first line. Consider what your goal is for the map and what problem you are trying to solve. Then, research your process and start to create your swimlane diagram.
Research
Before you sit down to diagram a process, it helps to consider what you need to map and why. What activities are essential to achieve your project or task? How do actors transfer assignments and communicate between steps? Who are the process and task owners?
For new processes, break activities into steps and define which roles, teams, and departments will own them. For existing processes, document what people do in the current process, not what they should do or what’s in the current documentation. Then, sketch out possible improvements. Finally, ask stakeholders how they view the steps you’ve added to the cross-functional flowchart.
Drawing
Although processes can be complex, a swimlane diagram should minimize the complexity as much as possible. To help make your diagram as intuitive as possible, follow these guidelines as you map your process:
Focus on who, what, and when to reduce visual noise.
Use shapes and colors consistently. Consider differentiating the swimlane shapes in each swimlane in a different color.
Create a hierarchy of important elements by using different shape sizes. In other words, make important items larger.
Add labels to show essential details for your audience.
You can also explore different options for the layout of a diagram. For example, consider the flow direction of your swimlane map. If you list actors in a column on the left, your top row can mark phases in the process or timeline. People often use a two-column top-to-bottom flow with vertical lines to assess value-added activities in value stream map templates.
Some people also think swimlane diagrams work best with linear processes and less well when describing processes that extend in many branches from a central activity.
If you map complex activities or overviews for a large organization, consider drawing separate diagrams for each activity or creating pools to contain subprocesses and actors.
Here are a few steps to make the process run smoothly:
Choose a free ready-made swimlane template. For a prototype, use different colored sticky notes to sketch your process.
Create two columns of rows. In the left-hand column, write your actors, the people, jobs, or tools who will perform activities. Create swimlanes. Add as many as you need to depict your process.
Enter the starting point in a rounded rectangle circle in the upper left lane and label it.
Add and label additional steps in each lane as appropriate, connecting each step to the previous step or steps with a line as you would in a flowchart. Conventionally, you work down and to the right as you chart progress. Add arrows to indicate the process flow. Lines can cross swimlanes as the output of one step moves to the next step.
Label elements with short descriptions. Keep the diagram clean.
Share the prototype with team members and other stakeholders for verification, and keep your diagram updated as things change.
How to supercharge swimlane creation with Miro AI
Building comprehensive swimlane diagrams can feel overwhelming when you're staring at a blank canvas. You know your process inside and out, but translating that mental map into a clear visual representation? That's where things get tricky.
Miro's AI-powered visual canvas transforms this challenge into an opportunity. Instead of starting from scratch, you can leverage intelligent assistance to accelerate your diagram creation while ensuring you capture every critical detail.
Generate process content: Describe your workflow and let Miro AI create sticky notes with key process steps that you can organize into your swimlane diagram.
Organize scattered ideas: Transform messy brainstorming sessions into structured content by having AI group related activities and suggest which swimlane each belongs in.
Create supporting documentation: Ask Miro AI to generate process descriptions, identify handoff points, and highlight improvement opportunities based on your swimlane diagram.
Get content suggestions: Receive AI-powered recommendations for missing process steps, decision points, and workflow optimizations to enhance your swimlane diagram.
Ready to experience AI-powered process mapping? Try a new way of building your swimlane diagram on Miro's innovation workspace and see how AI can transform your approach to visual collaboration.
Author: Miro Team Last update: October 9, 2025