Value stream mapping templates
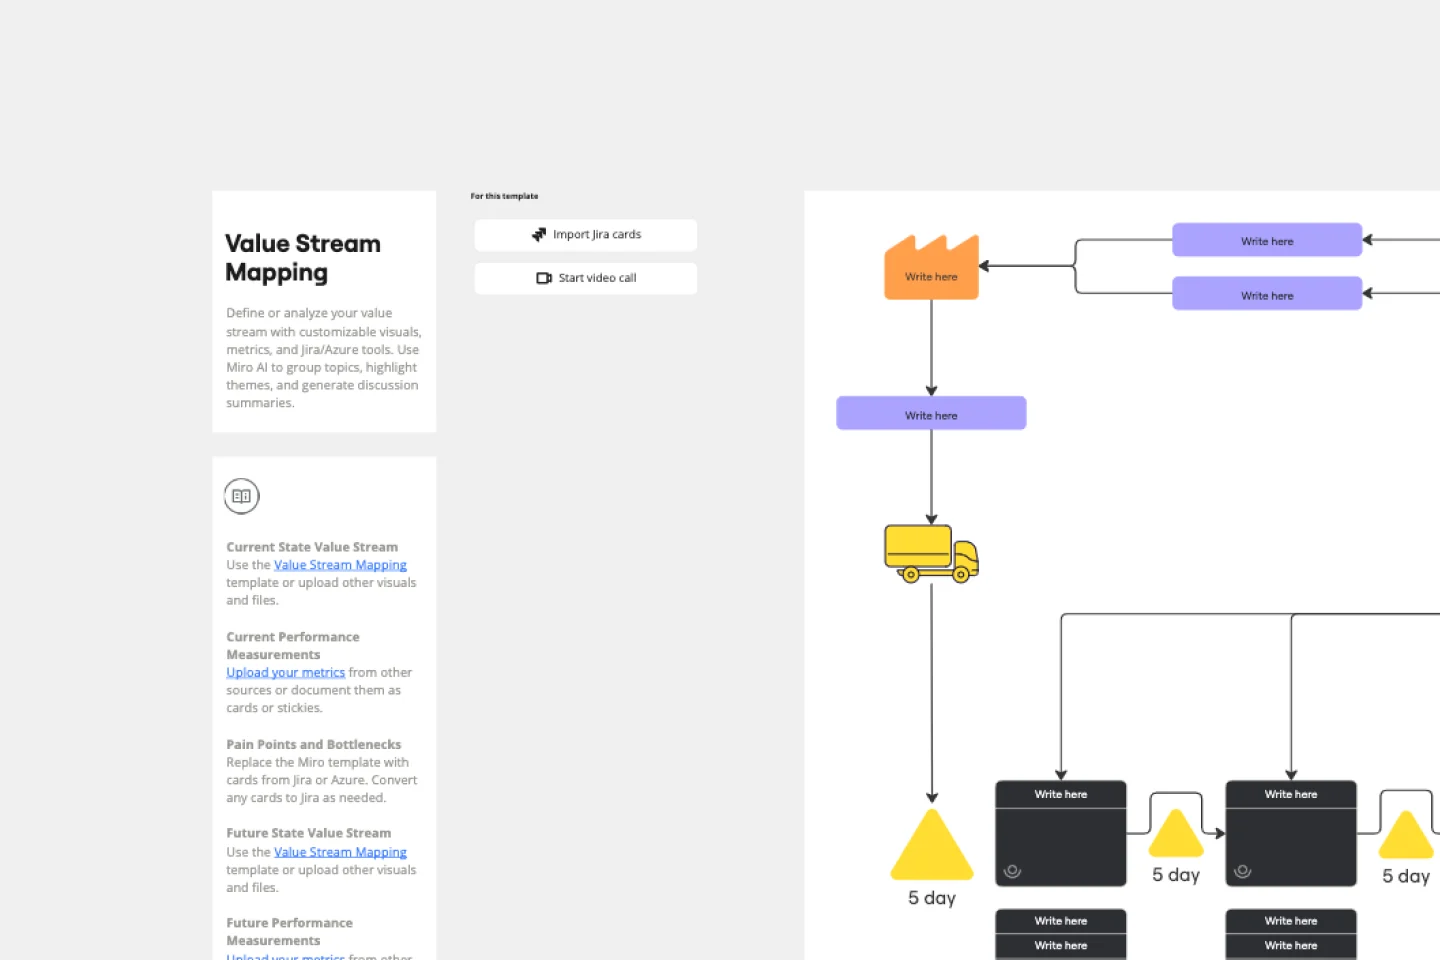
Miro's value stream map templates help you visualize workflows and optimize processes effortlessly. Whether you're analyzing, planning, or improving, these templates provide a clear structure to identify bottlenecks, enhance efficiency, and drive continuous improvement.
Value Stream Mapping SAFe Template
Works best for:
Agile, Value Stream Mapping
The Value Stream Mapping SAFe Template in Miro is designed to help teams visualize and optimize their workflows within the Scaled Agile Framework (SAFe). This template provides a structured approach to mapping out the current state of your value stream, identifying bottlenecks and inefficiencies, and planning for a more efficient future state. By leveraging this template, teams can ensure that they are aligned with SAFe principles and continuously improving their processes.
Value Proposition Template
Works best for:
Strategy & Planning, Product Strategy
The Value Proposition Template is a framework that empowers businesses to articulate their offerings' core advantages. By breaking down an offering into its essential elements, this template ensures that stakeholders grasp the unique value a product or service brings to the market.
Process Map Template
Works best for:
Agile Methodology, Product Management, Mapping
Process mapping allows you to assess, document, and strategize around any plan or approach your team has put in place. It’s a useful tool for eliminating or preventing blockers. Organized by stages, a process map enables your team to divide up a process or system and record deliverables and action items at each stage of the process. By breaking down the objectives, activities and deliverables at any stage of a project, you can gain insight into whether you are on track or effectively working through a problem.
Value Stream Mapping Template
Works best for:
Project Management, Strategic Planning, Mapping
A value stream map can help you refocus your business on steps that actually provide value to your customers, cutting out wasteful and inefficient processes. With this template, you and your process team can collaborate on a value stream map today.
Value Chain Analysis Template
Works best for:
Leadership, Strategic Planning, Workflows
First coined by Harvard Business School professor Michael Porter, the value chain analysis helps your team evaluate your business activities so you can find ways to improve your competitive advantage. A value chain is a set of activities that a company performs in order to deliver a valuable product from start to finish. The analysis itself allows your team to visualize all the business activities involved in creating the product—and helps you identify inefficiencies, bottlenecks, and miscommunication within the process.
BPMN Diagram for Process Improvement Template
Works best for:
BPMN
The BPMN Diagram for Process Improvement template helps visualize steps to enhance workflows, reduce inefficiencies, and promote knowledge sharing. Perfect for teams focused on continuous improvement, it ensures processes are streamlined, clearly understood, and aligned with organizational goals, fostering a culture of collaboration and innovation.
Join thousands of teams collaborating and doing their best work on Miro.
Sign up freeAbout the value stream mapping templates collection
Our value stream mapping templates are designed to help teams visualize and optimize their workflows. These templates provide a structured approach to identifying inefficiencies and areas for improvement, making it easier for teams to streamline their processes and enhance productivity. Whether you're new to value stream mapping or looking to refine your existing practices, Miro's templates offer a user-friendly and effective solution.
Why you'll love our value stream mapping templates
Using Miro's value stream mapping templates comes with many benefits:
Ease of use: Designed with beginners in mind, these templates are intuitive and easy to navigate, allowing you to focus on mapping your processes without getting bogged down by complex tools.
Advanced diagramming: Leverage Miro's advanced diagramming capabilities to create detailed and precise value stream maps. This helps in accurately identifying bottlenecks and areas for improvement.
Collaboration: Miro's collaborative features enable team members to work together in real-time, ensuring
that everyone is on the same page and contributing to the process.
Customization: Tailor the templates to fit your specific needs. Add or remove elements, adjust layouts, and incorporate your own data to create a value stream map that truly reflects your workflow.
Visualization: Transform complex processes into clear, visual representations that are easy to understand and communicate to stakeholders.
How to use the value stream mapping templates in Miro
Select a template: Start by choosing a value stream mapping template from Miro's template library. You can find templates that cater to various industries and use cases.
Define your process: Identify the process you want to map. This could be anything from product development to customer service workflows.
Map the current state: Use the template to map out the current state of your process. Include all relevant steps, activities, and information flows.
Identify bottlenecks: Analyze the current state map to identify any bottlenecks or inefficiencies. Look for areas where delays occur or resources are underutilized.
Design the future state: Create a future state map that outlines an optimized version of your process. Incorporate improvements and changes that address the issues identified in the current state.
Implement changes: Use the insights gained from your value stream maps to implement changes in your workflow. Monitor the impact of these changes and make further adjustments as needed.
Following these steps, you can use our value stream mapping templates to improve your team's efficiency and productivity. These templates not only help visualize and understand your processes but also provide a clear path for continuous improvement, enabling your team to thrive.
