
Categories
Similar templates
OKR Board for Product, UX and Engineering Teams
497 likes
3.2K uses

5E Service Blueprint
37 likes
274 uses

Workshop: How to Setup User Insight Management
36 likes
86 uses

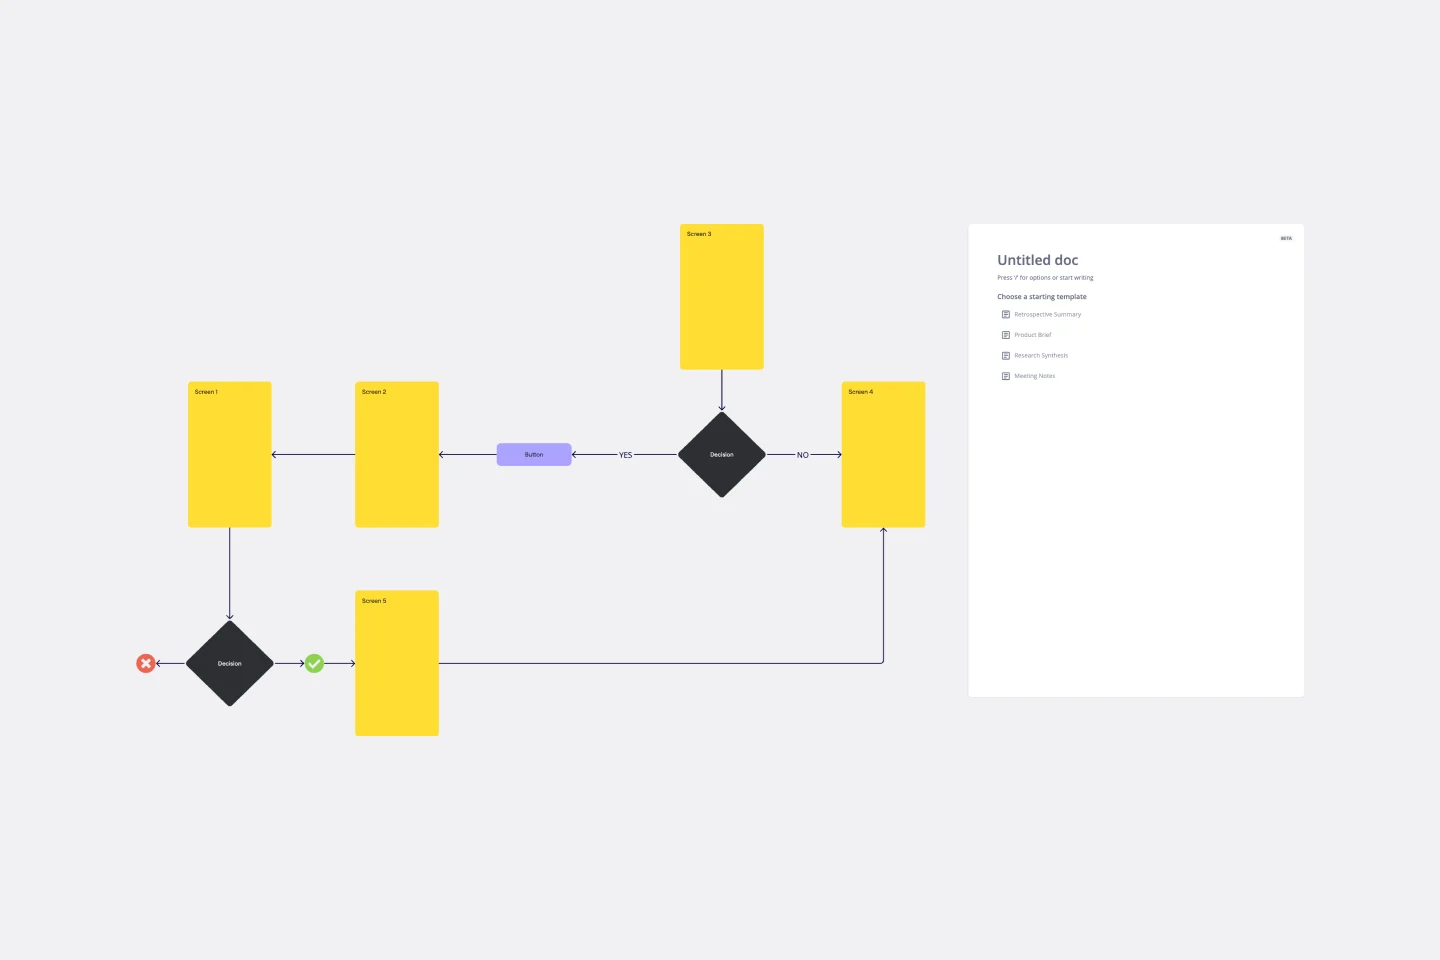
User Flow Template
4 likes
501 uses
OKR Board for Product, UX and Engineering Teams
497 likes
3.2K uses
5E Service Blueprint
37 likes
274 uses
Workshop: How to Setup User Insight Management
36 likes
86 uses
User Flow Template
4 likes
501 uses