UML Use Case Diagram
Visualize system interactions with the UML Use Case Diagram. Map out user interactions and system processes for better planning.
About the [UML Use Case Diagram] template
Since the 1990's the Universal Modelling Language (UML) has been the lingua franca of how people document IT systems. It is an internationally recognized standard consisting of 14 diagrams in two categories: behavior diagrams (that document how systems work and interact) and structural diagrams (that document how systems are structured.
The UML Use Case Diagram is without doubt the most common behavioral diagram. It visually represents the functional requirements of a system, illustrating the interactions between users (actors) and the system to achieve specific goals (use cases).
Who can use this [UML Use Case Diagram] template
This template can be used by anyone who needs to create a UML Use Case Diagram.
How to use this [UML Use Case Diagram] template
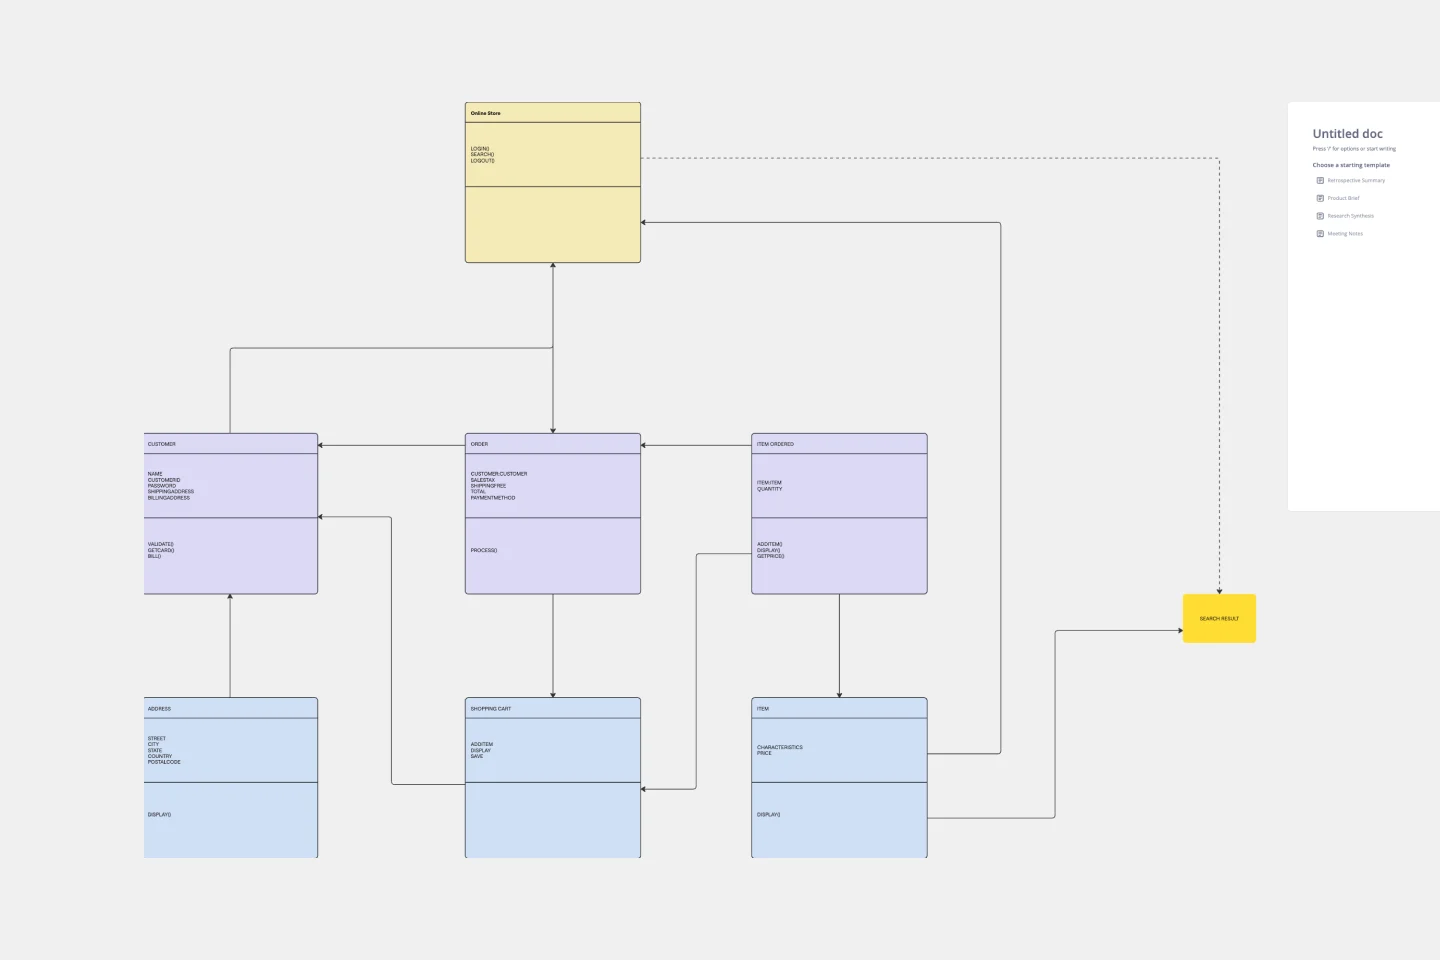
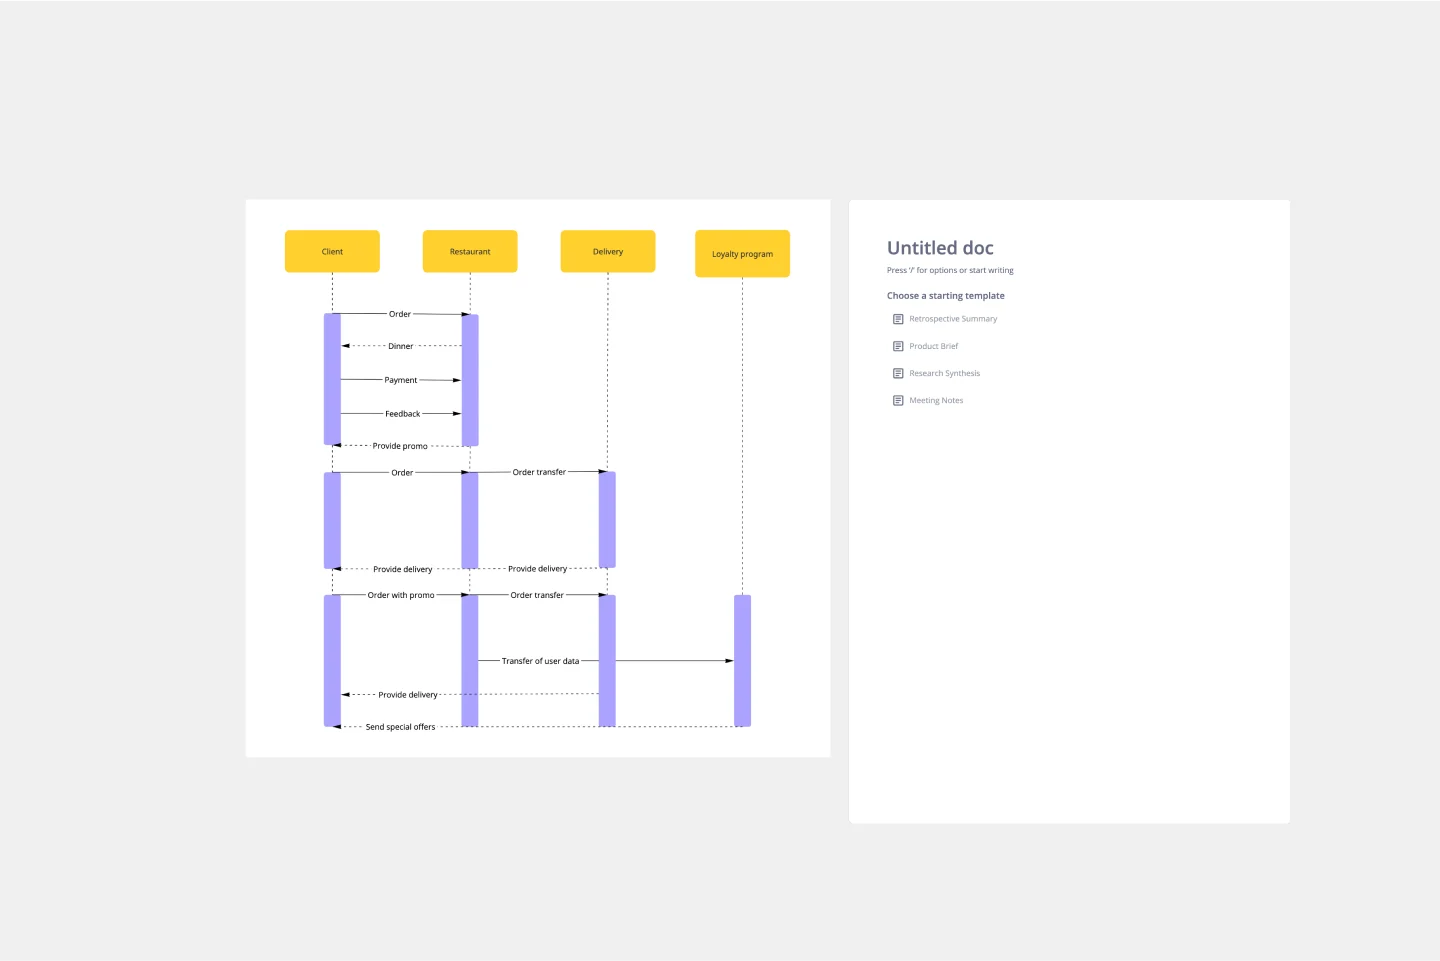
This template contains two sample UML Use Case diagrams: one that has been created with Miro's built-in diagramming symbols, and one that uses some custom symbols. For simple diagrams, the built-in Miro symbols will probably work well. But in some cases (such as when the text is very long) not all the built-in Miro symbols will look as aesthetically pleasing as they could.
What this [UML Use Case Diagram] helps you accomplish
If you need to create a UML Use Case diagram, this template can hopefully make the job a bit easier and faster. Instead of starting from scratch, you can copy-and-paste this diagram into your own template and customize as you require.
Tips and best practices
Identify your actors and systems clearly
Keep it simple and high-level
Use descriptive names (e.g. "order pizza")
Take a goal-oriented approach. In other words, what goals do the actors have and what use cases are required for the actors to achieve their goals.
Feedback and Suggestions for Improvement are very welcome!
The author would be very grateful for any feedback and suggestions to improve this template!
Get started with this template right now.
UML Class E-Commerce System Template
Works best for:
UML
The UML Class E-Commerce System Template streamlines the process of creating and visualizing the class structure of an e-commerce system. It provides a comprehensive framework that includes typical online shop features such as product listings, inventory management, shopping carts, orders, payments, and shipping details. This template facilitates a clear understanding of how these elements interact during an online sales transaction, making it an invaluable tool for teams working on e-commerce projects. By using this template, teams can save time, enhance collaboration, and ensure that their system architecture is robust and efficient, ready to adapt to their business's evolving needs.
Cladogram Template
Works best for:
Diagramming
The Cladogram Template offers seamless adaptability, empowering users to change, expand, and refine evolutionary representations with ease. Its intuitive interface and automated features ensure dynamic and responsive diagrams that keep up with evolving knowledge. Say goodbye to static diagrams and welcome fluidity and adaptability with Miro's Cladogram Template.
Supply Chain Diagram Template
Works best for:
Diagramming
The Supply Chain Diagram Template is great for businesses to streamline and enhance their supply chain processes. This template lets you visualize the entire supply chain, from sourcing raw materials to delivering finished products. Its intuitive layout simplifies complex networks, making identifying key areas and potential bottlenecks easier. One of the standout benefits of using this template is its clarity. It bridges the gap between complex processes and strategic decision-making by presenting a clear, visual supply chain representation. This clarity enables teams to pinpoint inefficiencies and implement more effective management strategies, which optimizes operations and facilitates better communication and understanding across different departments within an organization.
4-Circle Venn Diagram Template
Works best for:
Diagramming, Mapping, Brainstorming
The 4-Circle Venn Diagram Template has an easy, interactive, and dynamic way to visualize complex relationships between data sets. Empower your team's collaboration and communication with this powerful tool.
Innovation Diagram - S.PSS
Works best for:
Diagramming
The Innovation Diagram_S.PSS template offers a visual framework for mapping out the innovation process using the S.PSS (Service Product System Strategy) approach. It provides elements for defining service components, product features, and system interactions. This template enables teams to visualize and communicate their innovation strategy, facilitating alignment and collaboration across stakeholders. By promoting systematic innovation and holistic thinking, the Innovation Diagram_S.PSS empowers organizations to drive sustainable growth and competitive advantage through service and product innovation.
Google Cloud Architecture Diagram Template
Works best for:
Software Development, Diagrams
Use the Google Cloud Architecture Diagram template to clearly visualize the deployment of your application and allow you and your team to optimize processes. The GCP template gives you a great overview of your application architecture, and it helps you to iterate quickly and better manage your application development, deployment, and documentation. Try it out and see if it works for you.