UML Sequence Rental Booking System Template
Streamline the documentation and visualization process of interactions within rental booking systems with the UML Sequence Rental Booking System Template.
Available on Enterprise, Business, Education plans.
About the UML Sequence Rental Booking System Template
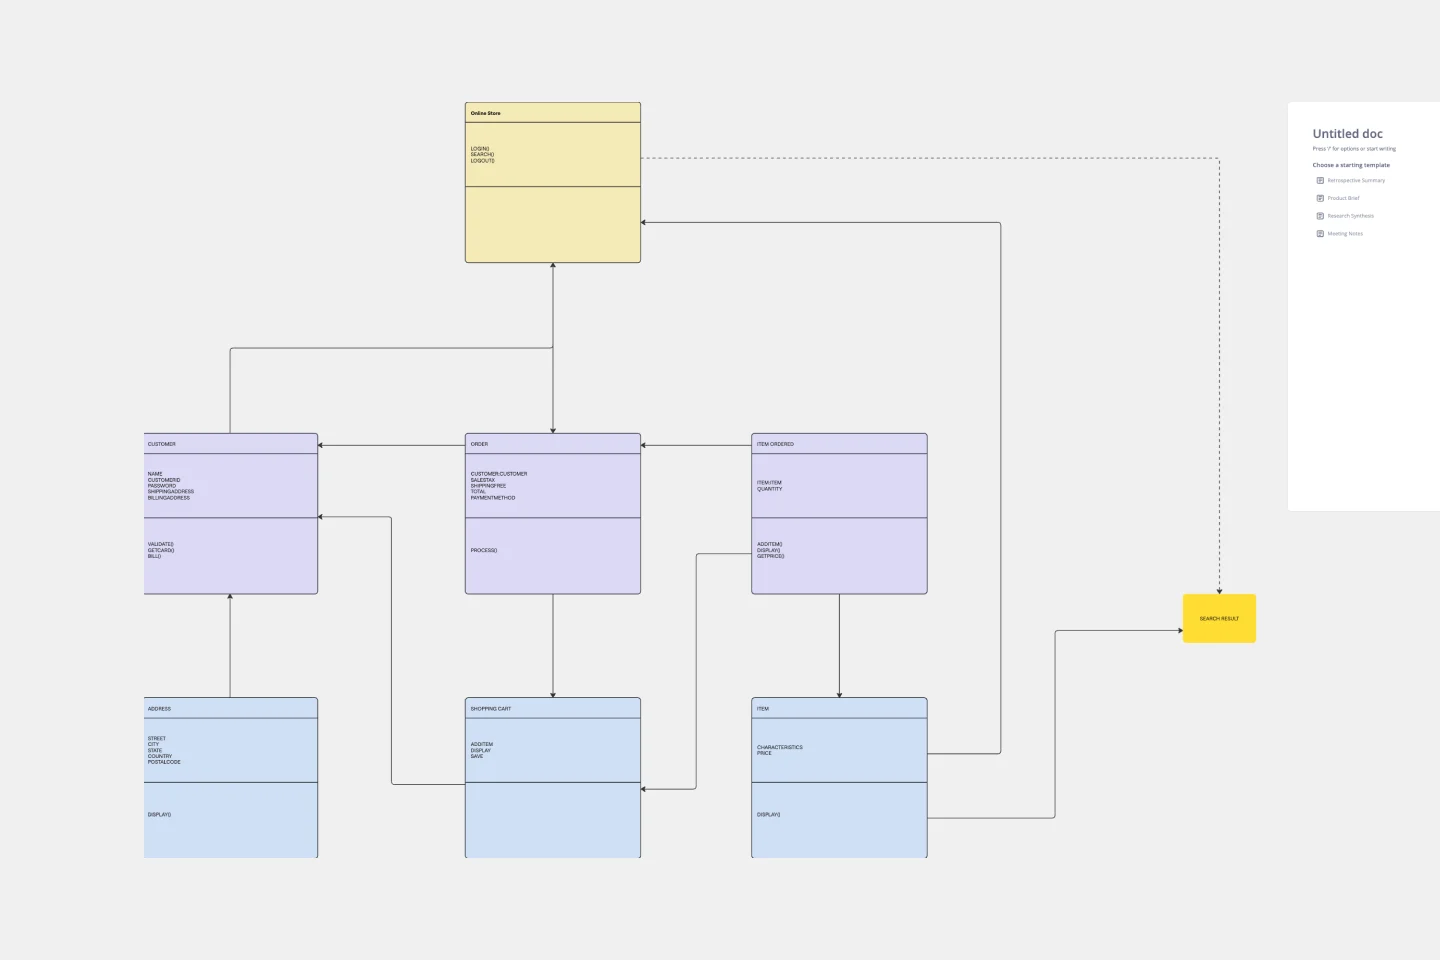
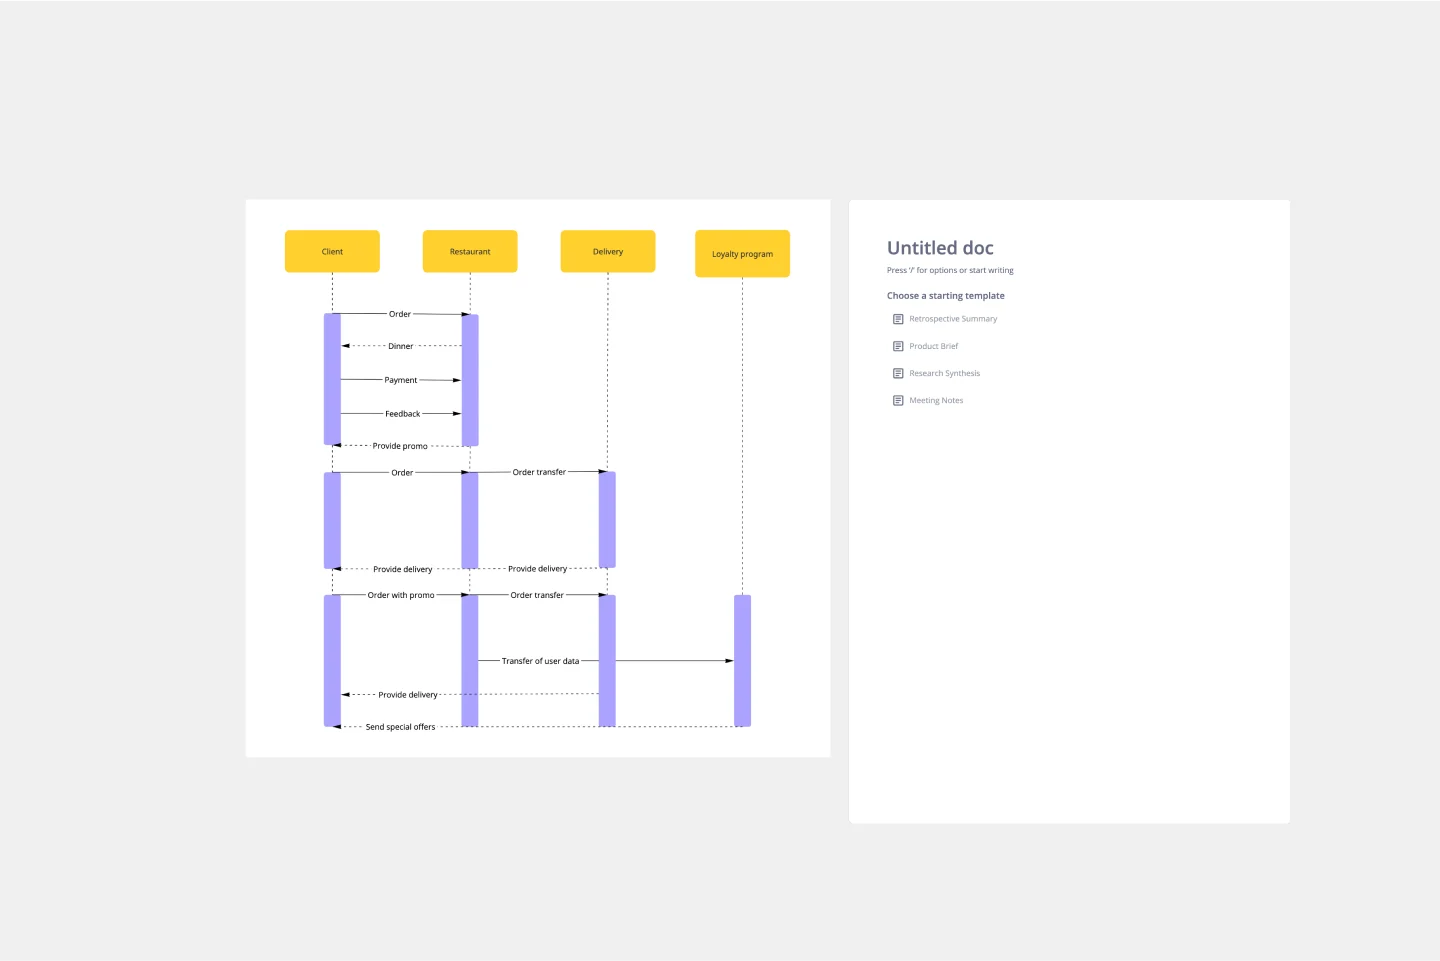
The UML Sequence Rental Booking System Template in Miro is designed to streamline the process of documenting and visualizing the interactions within a car rental booking system. This template aids in mapping out the communication flow between the customer, user interface, payment service, and vehicle allocation system, ensuring a smooth and efficient workflow. By using this template, teams can understand the sequence of interactions necessary for a successful rental booking process.
How to use the UML Sequence Rental Booking System Template
Customize the template: Once the template is open on your board, you can start customizing it to fit your specific project needs. Miro allows you to add, remove, or modify the elements within the template easily. For more complex diagrams, use Miro's UML shape packs or integrate with text-to-diagram apps like PlantUML and Mermaid.
Collaborate in real time: Invite your team members to collaborate on the diagram in real-time. Miro's collaborative features enable you to work together seamlessly, regardless of your physical location. Use comments, @mentions, and live editing to gather input and make decisions efficiently.
Iterate and refine: As your project evolves, so too will your understanding of the necessary interactions within the rental booking system. Use Miro to iterate on your diagram, refining it to accurately reflect the system's architecture and flow.
Share and present: Once your diagram is complete, share it with stakeholders directly from Miro. You can also present your diagram during meetings using Miro's presentation mode, ensuring everyone is aligned on the system's design.
Why use the UML Sequence Rental Booking System Template
Clarity and understanding: The template offers a visual representation of the interactions within a rental booking system. This visual aid helps team members and stakeholders easily understand the system's flow and requirements, promoting a clear understanding of complex systems.
Efficiency: Utilizing a pre-made template saves time that would otherwise be spent on creating diagrams from scratch. This efficiency allows teams to focus more on refining the system's architecture and interactions rather than on the mechanics of diagramming.
Collaboration: Miro's collaborative environment enhances teamwork by enabling multiple users to contribute to the diagram simultaneously. This feature is especially beneficial for remote or distributed teams, as it supports real-time communication and iteration, ensuring that everyone is aligned and can contribute effectively, regardless of their location.
Get started with this template right now. Available on Enterprise, Business, Education plans.
Data Flow Diagram Template
Works best for:
Flowcharts, Software Development, Diagrams
Any process can get pretty complex, especially when it has multiple components. Get a better grasp of your process through a data flow diagram (DFD). DFDs create a simple visual representation of all components in the flow of data and requirements in an entire system. They’re most often used by growth teams, data analysts, and product teams, and they’re created with one of three levels of complexity—0, 1, or 2. This template will help you easily build the best DFD for your process.
Force Field Analysis Template
Works best for:
Diagramming, Strategic Planning
A Force Field Analysis Template is a powerful tool that helps teams identify and analyze the forces supporting or hindering progress toward a specific change or goal. This template provides a visual space where you can brainstorm and plot out 'driving forces' that push objectives forward and 'restraining forces' that prevent advancement, all on a single, intuitive board. One of the primary benefits of utilizing the Force Field Analysis template is that it fosters a shared understanding among team members. By visually mapping out and discussing each force, teams can prioritize efforts, build consensus on the central issues to tackle, and collaboratively devise strategic plans to strengthen positive influences while reducing negative ones.
Cause and Effect Diagram Template
Works best for:
Diagramming
The Cause and Effect Diagram Template is a useful tool for analyzing complex relationships, identifying root causes of problems, and improving organizational processes. It can be customized to fit user's unique needs and provides a structured framework for analysis. Teams can use real-time collaborative analysis on the Miro platform to drive continuous improvement initiatives.
Define A Winning Product Vision
Works best for:
Product Management, Planning
The Define A Winning Product Vision template assists product teams in articulating compelling visions for product development. By defining goals, target markets, and differentiation strategies, this template aligns teams around a shared vision for success. With sections for outlining product features, benefits, and value propositions, it communicates the essence of the product effectively. This template serves as a guiding light for product development efforts, inspiring creativity and focus as teams work towards bringing the product vision to life.
The Tiered Pricing Canvas - Product Plans
Works best for:
Product Management, Planning
The Tiered Pricing Canvas - Product Plans template helps product managers design tiered pricing strategies effectively. By mapping out pricing tiers, features, and value propositions, this template enables teams to optimize pricing models and maximize revenue. With sections for analyzing customer segments and competitive pricing, it supports data-driven pricing decisions. This template serves as a guide for crafting compelling pricing plans that align with customer needs and market dynamics, driving profitability and customer satisfaction.
Value Network Mapping (1.0)
The Value Network Mapping (1.0) template is a visual tool for analyzing and optimizing the relationships and interactions between stakeholders within a network. It provides a structured framework for mapping out value exchanges, dependencies, and opportunities for collaboration. This template enables teams to gain insights into the dynamics of their ecosystem, identify key actors, and align strategies for mutual benefit. By promoting transparency and collaboration, Value Network Mapping empowers organizations to enhance value creation and foster strategic partnerships.