UML ERD Diagram
This template contains a few Entity-Relationship diagrams that you can re-use for your own work.
About the UML ERD Diagram template
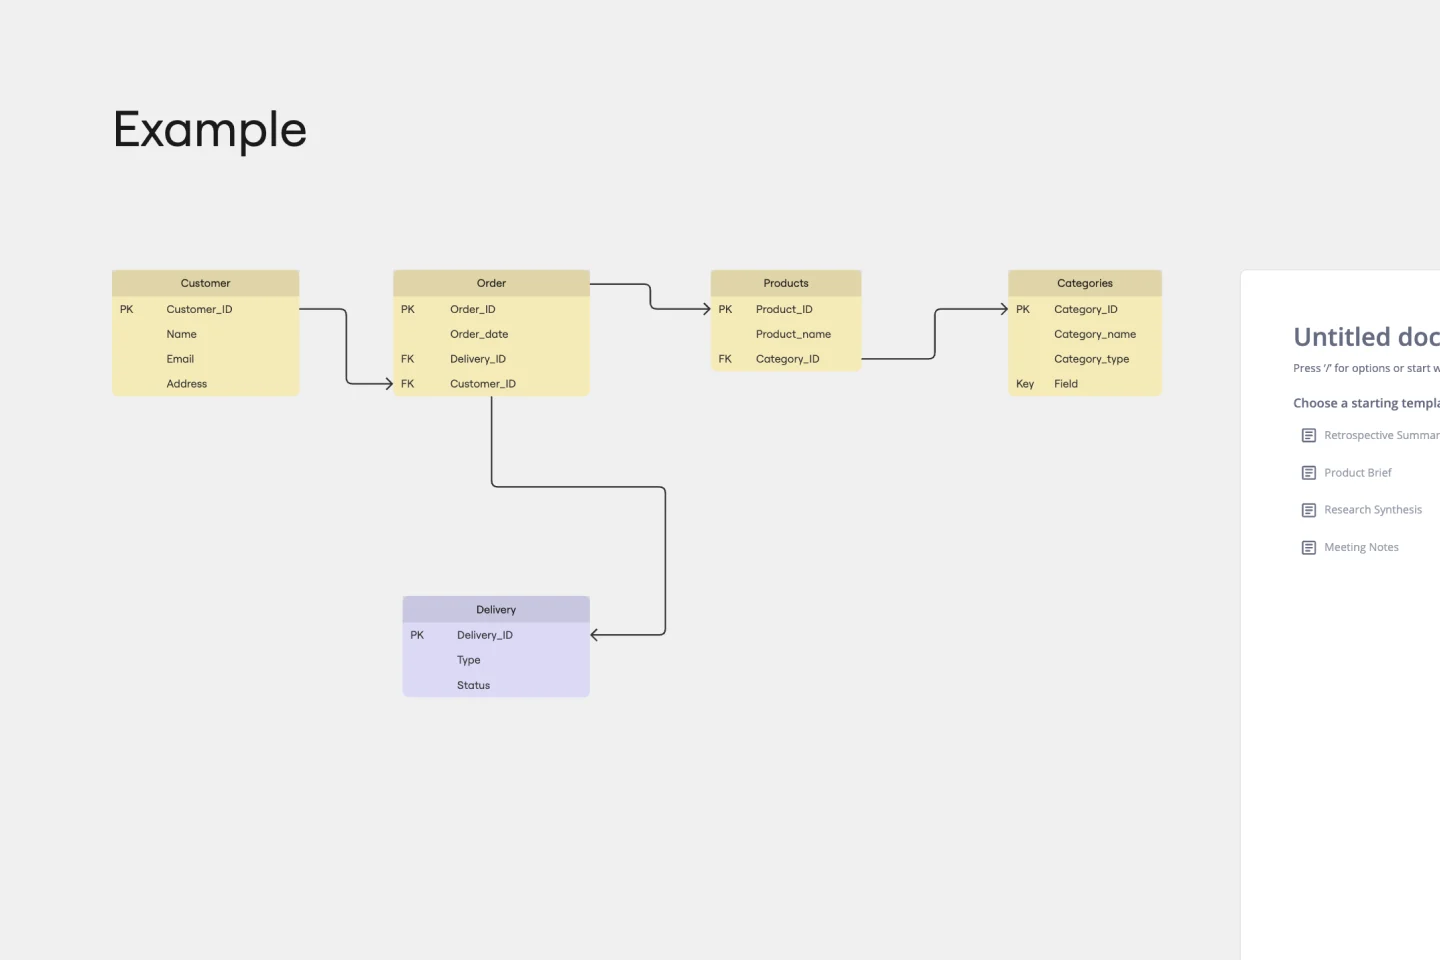
This template contains a few Entity-Relationship diagrams that you can re-use for your own work. It also contains a short tutorial about how to create your own ERDs from scratch. Because ERDs are impossible to create without a real-world situation, the diagrams in this template have adopted the well-known teacher/class/student example that is a common example in many ERDs.
Who can use this UML ERD Diagram template
This template is expected to be used mainly by information technology specialists, particularly those with a focus on data
How to use this UML ERD Diagram template
Simply cut-and-paste the diagrams you need into your own boards!
What this UML ERD Diagram helps you accomplish
Instead of re-creating the wheel from scratch, by cutting and pasting ready-to-use ERDs into your own boards, this should considerably speed up your work!
Tips and best practices
Miro has a significant advantage over many modelling tools because of its vector-oriented graphics. You can easily select the shapes and then re-scale them to any size you need
Get started with this template right now.
Dependency Diagrams Educational Board
Works best for:
Diagramming
The Dependency Diagrams Educational Board template provides a visual tool for teaching and learning about dependency relationships between components in systems. It offers a structured framework for illustrating dependencies, connections, and interactions within a system or process. This template enables educators to explain complex concepts effectively and engage learners in interactive activities. By promoting visual learning and understanding of dependencies, Dependency Diagrams empower students to grasp fundamental principles of systems thinking and analysis.
Sitemap Template
Works best for:
Mapping, Software Development, Diagrams
Building a website is a complex task. Numerous stakeholders come together to create pages, write content, design elements, and build a website architecture that serves a target audience. A sitemap is an effective tool for simplifying the website design process. It allows you to take stock of the content and design elements you plan to include on your site. By visualizing your site, you can structure and build each component in a way that makes sense for your audience.
Flowchart Template
Works best for:
Flowcharts, Mapping, Diagrams
Trying to explain a process or workflow to your team — or just wrap your head around it yourself? Sometimes the best way is to see it, and that’s when you create a flowchart. Using common shapes (generally just ovals, rectangles, diamonds, and arrows), a flowchart shows you the direction a process or workflow goes and the order of steps. Beyond giving you a clear understanding, you’ll also be able to see potential flaws and bottlenecks, which helps you refine and improve your process and create a better product more efficiently.
Azure Guidebook
Works best for:
Cloud Infrastructure
This Miro Board visualizes and connects all the necessary provisions for required resources in Azure DevOps, Microsoft Entra (formerly Azure Active Directory), and Azure.
UML Use Case Diagram
Works best for:
UML Diagrams, Diagramming
Visualize system interactions with the UML Use Case Diagram. This template helps you map out user interactions and system processes, providing a clear overview of functional requirements. Ideal for software developers, business analysts, and project managers, it supports planning and communicating system functionalities. Use it to ensure all user scenarios are considered and to facilitate better design and implementation of software systems.
Insightful Venn
Works best for:
Venn Diagram
Discover insights and visualize data relationships with the Insightful Venn template. This tool helps you compare multiple datasets, identify intersections, and understand unique and common elements. Use it for data analysis, research, and presentations to communicate complex information effectively. Perfect for analysts, educators, and researchers aiming to convey data-driven insights visually.