
Dmitry Ermakov
Engineering manager @ Worldline
Highly experienced engineering manager with strong expertise in leading teams and developing complex distributed systems. Passionate about fostering high-performing teams and utilizing modern backend, frontend, and cloud technologies. I enjoy being fully immersed in technical solutions and actively contributing through hands-on involvement. Have a track record of successfully completed projects across diverse organizations and domains.
Categories
Similar templates
BPM
128 likes
2.2K uses

OutSystems Architecture Diagram
65 likes
660 uses

How to Find and Describe Ideas
36 likes
47 uses

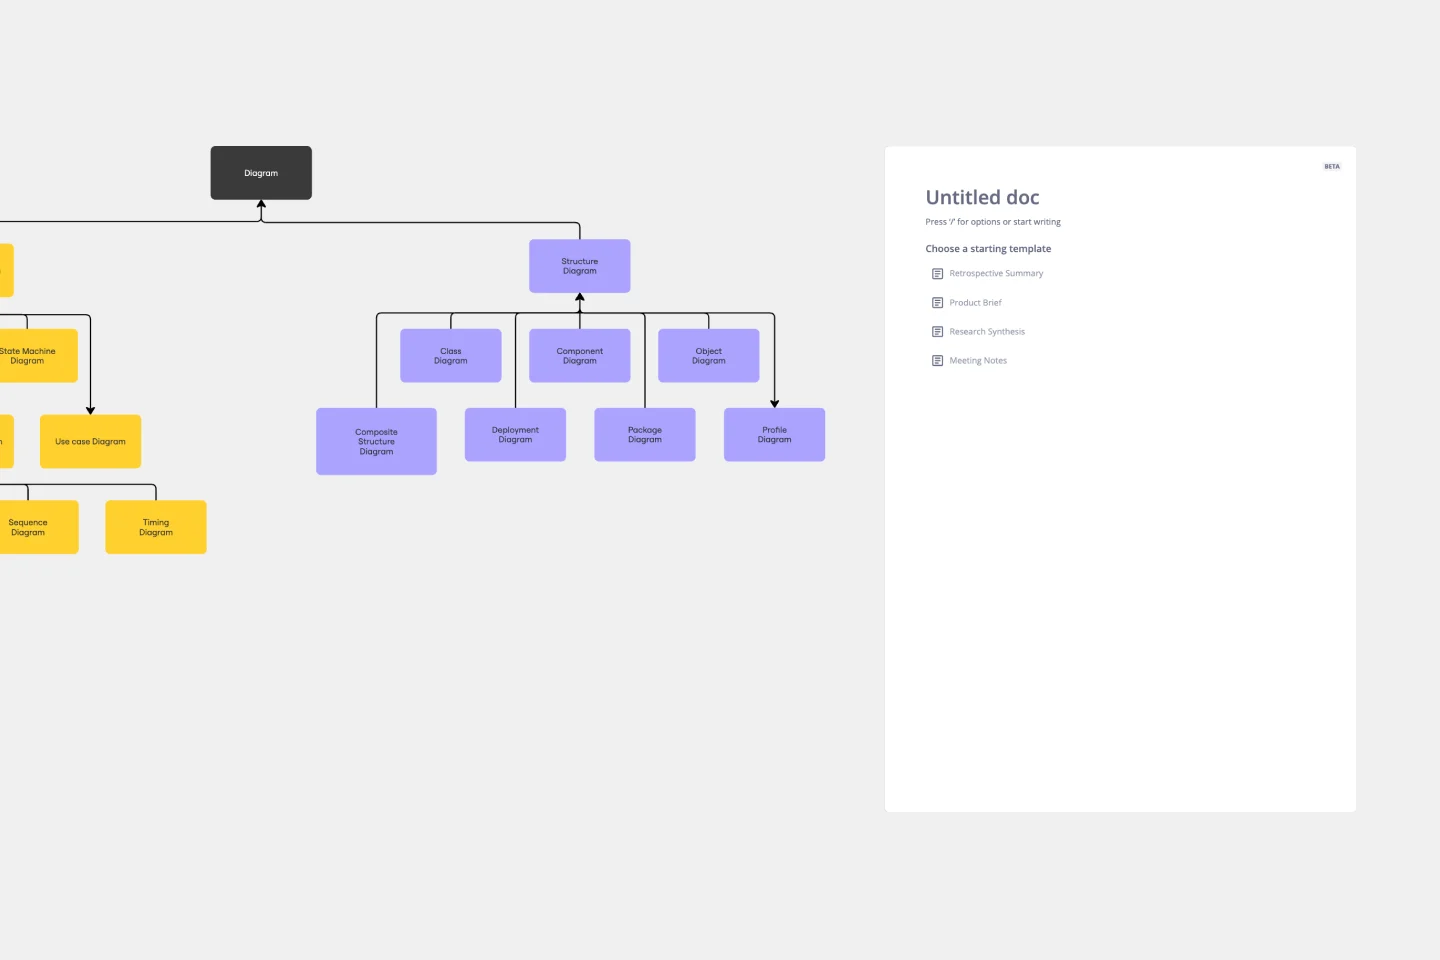
UML Diagram Template
4 likes
134 uses
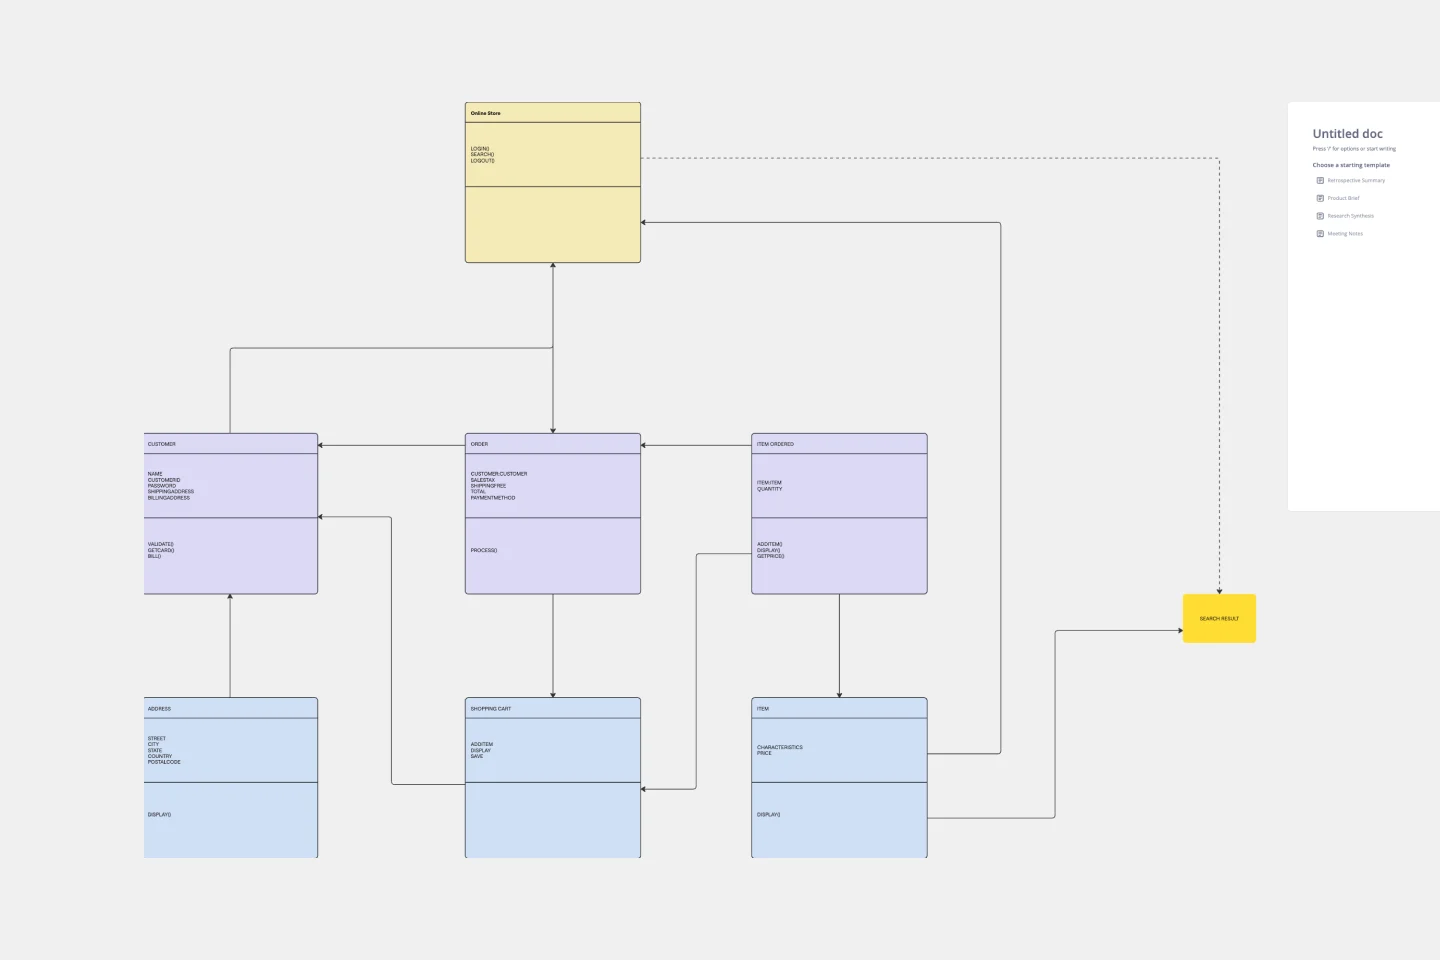
UML Class Diagram Template
0 likes
155 uses
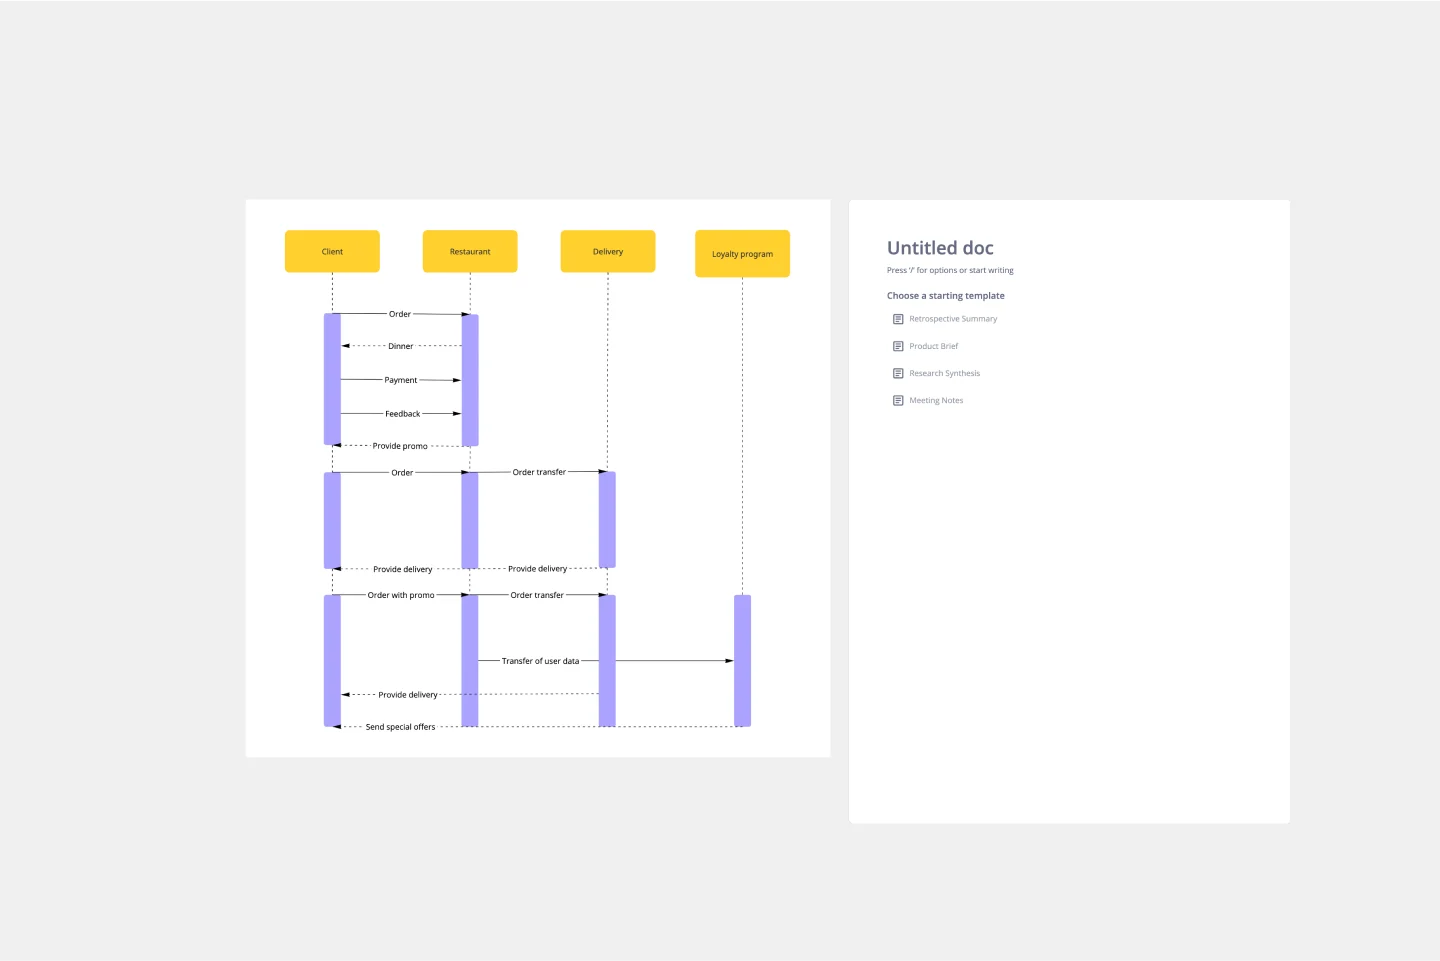
UML Sequence Diagram Template
2 likes
309 uses
BPM
128 likes
2.2K uses
OutSystems Architecture Diagram
65 likes
660 uses
How to Find and Describe Ideas
36 likes
47 uses
UML Diagram Template
4 likes
134 uses
UML Class Diagram Template
0 likes
155 uses
UML Sequence Diagram Template
2 likes
309 uses