Back to Diagramming & mapping
T-chart templates
Miro's T-chart templates help you compare and organize ideas effortlessly. Whether you're analyzing options, making decisions, or solving problems, these templates provide a clear structure to visualize pros and cons, identify patterns, and clarify choices.
18 templates
Advanced Project Gantt Chart Template
162 likes
504 uses

Gantt Chart for Project Scheduling
35 likes
492 uses

Gantt Chart Template
6 likes
405 uses
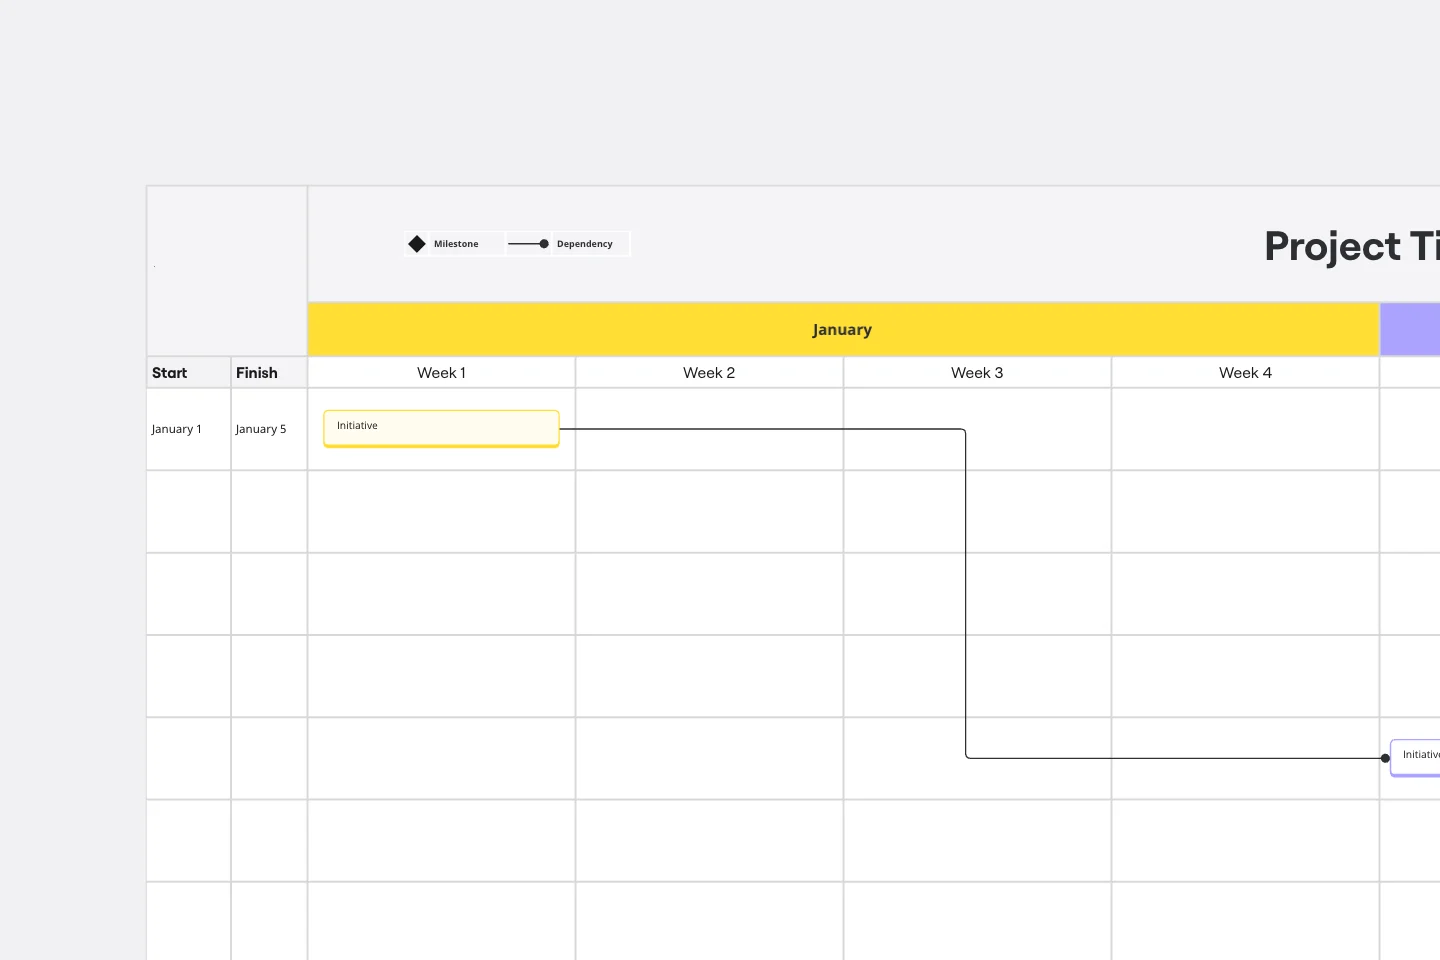
Gantt Chart Project
44 likes
375 uses

Agile Project Gantt Chart
60 likes
304 uses

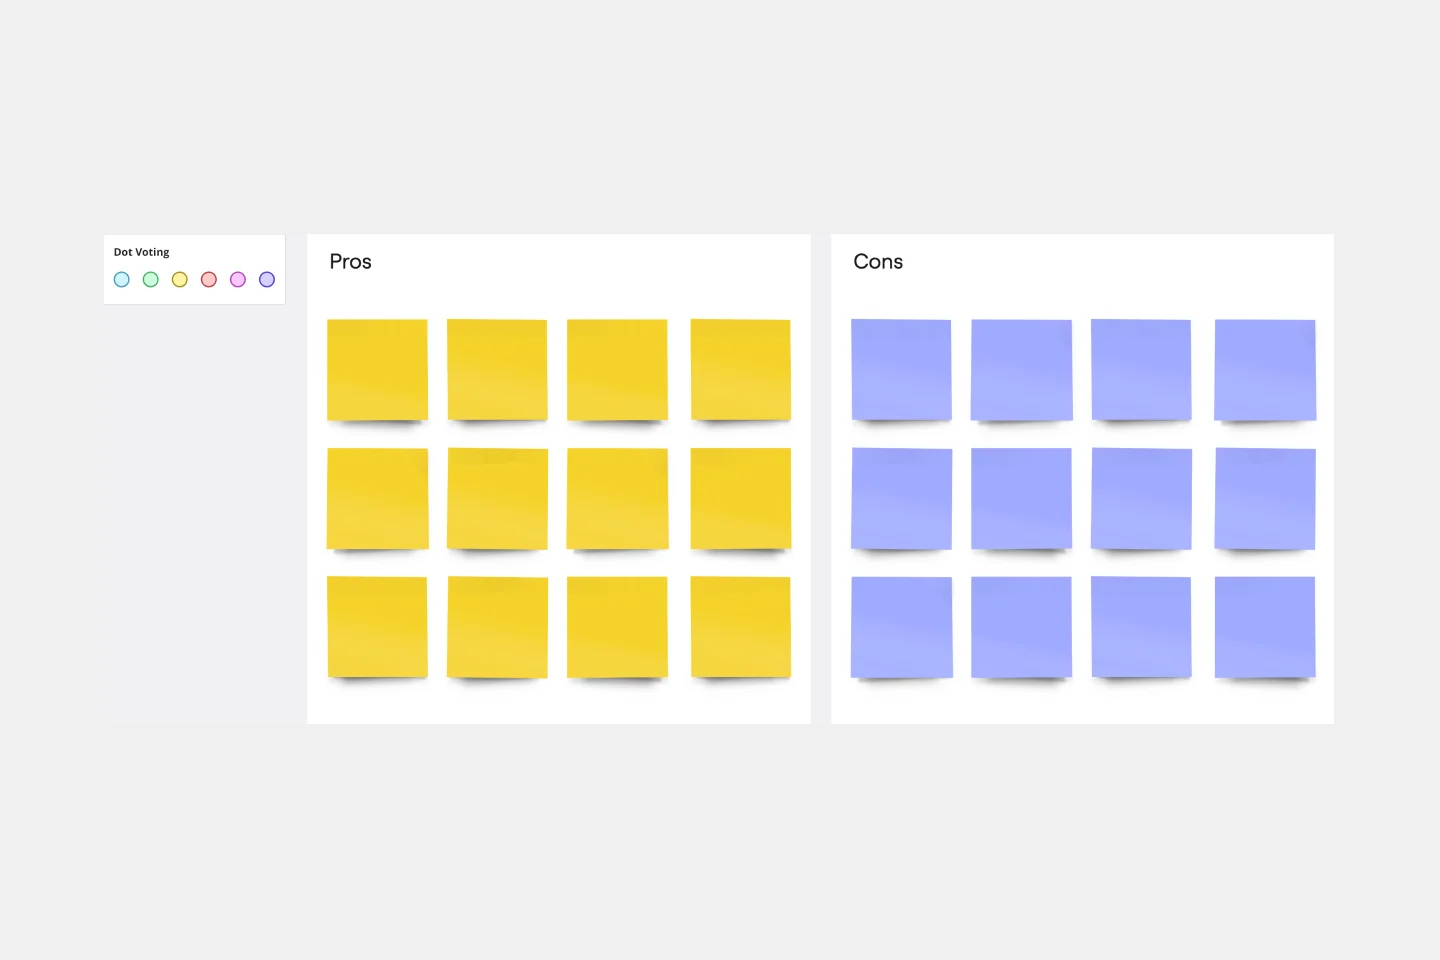
Pros and Cons List Template
0 likes
244 uses
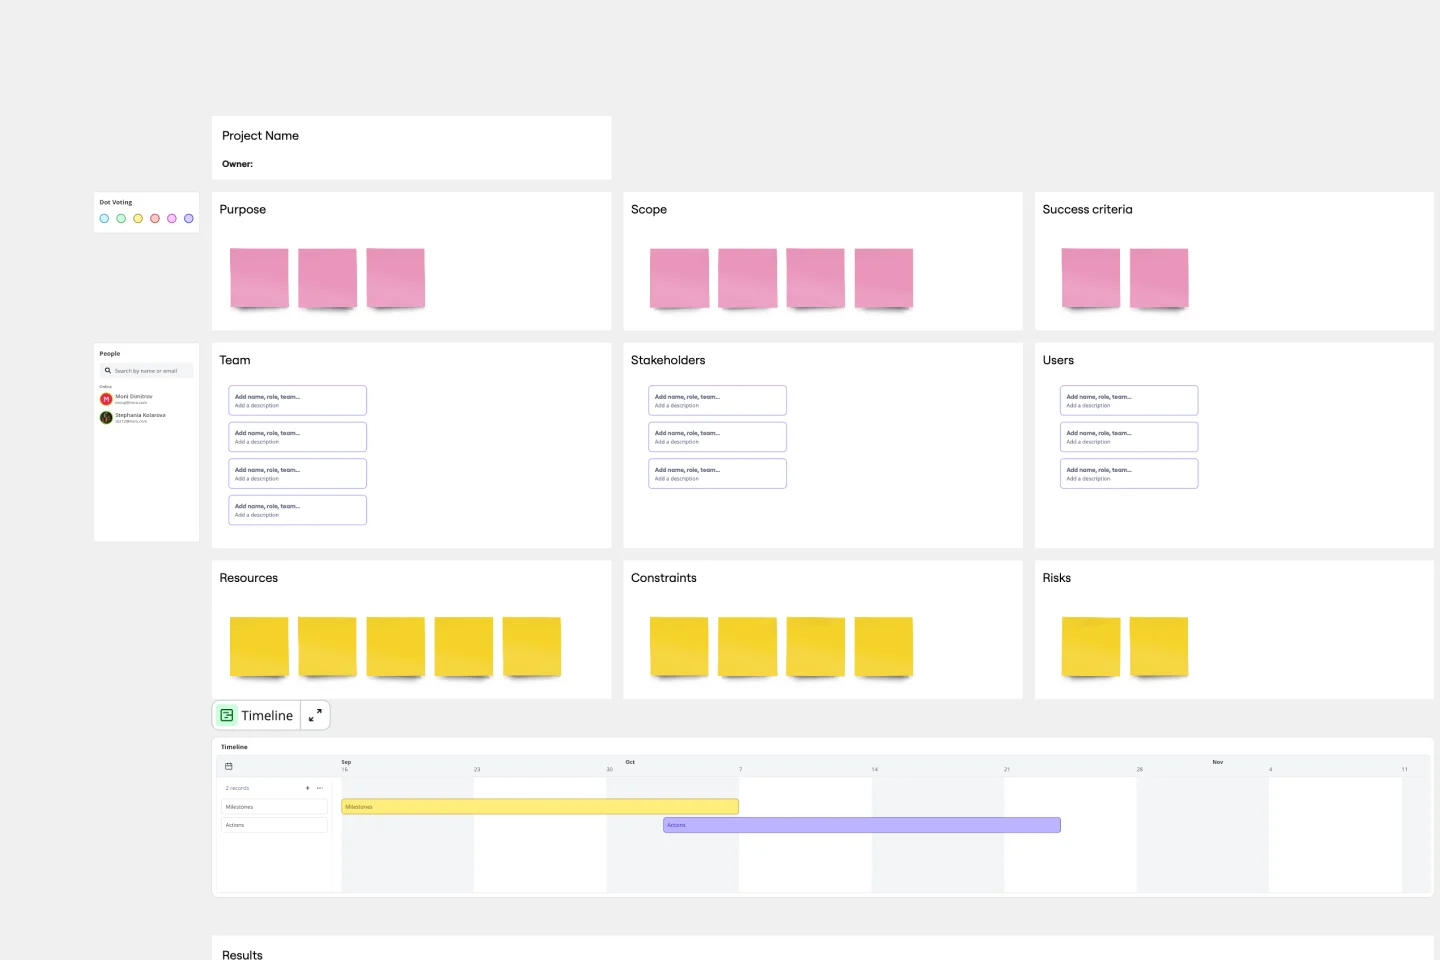
Your Project Charter
70 likes
192 uses

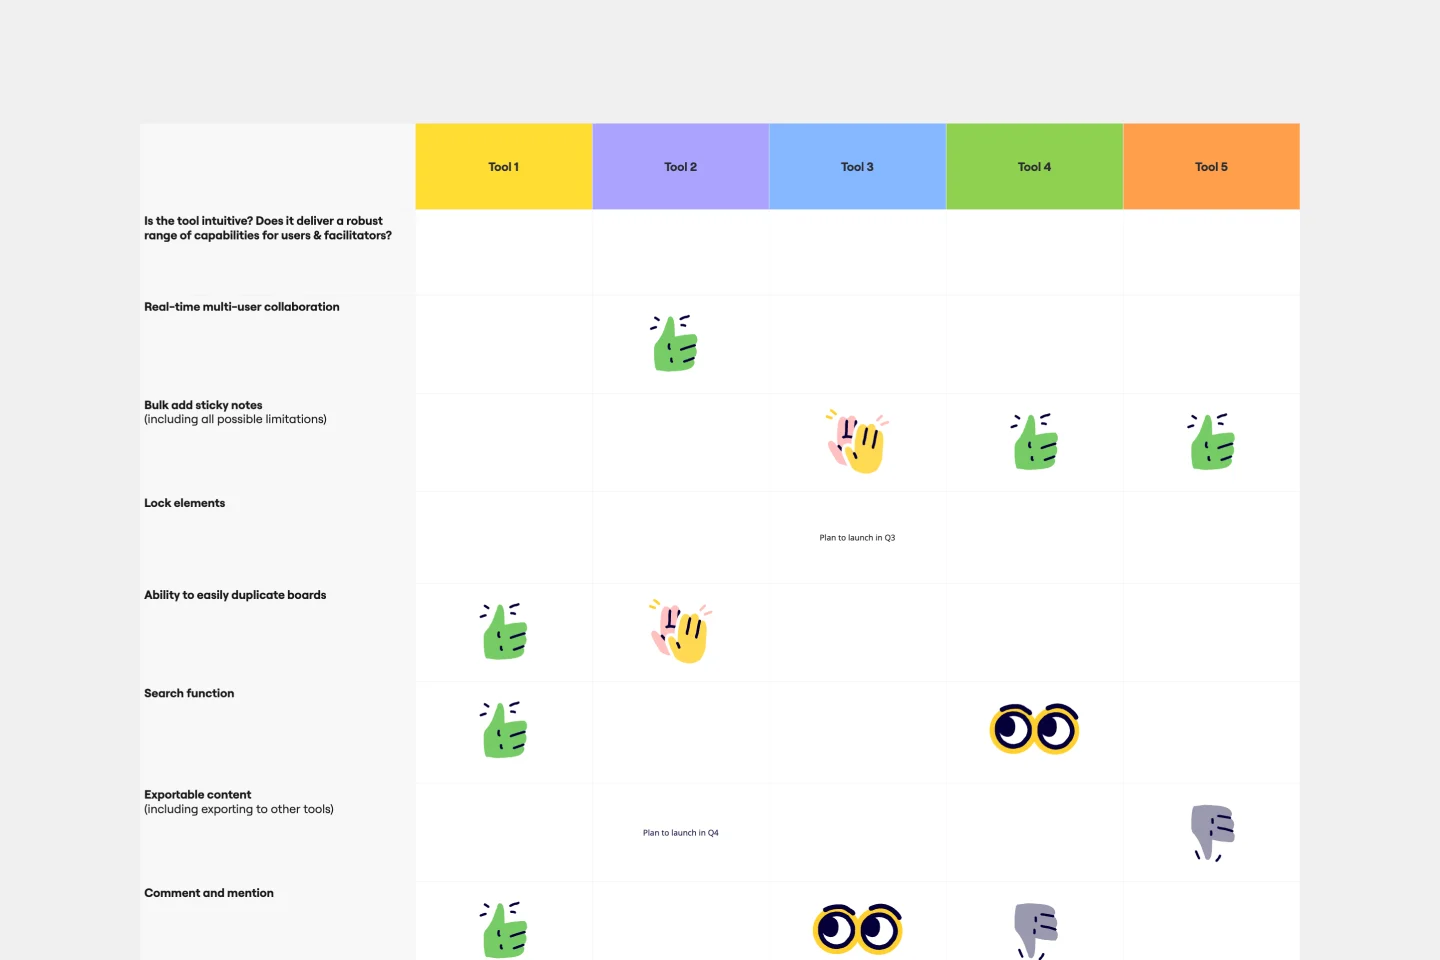
Comparison Chart Template
1 likes
185 uses
Basic Gantt Chart
11 likes
178 uses

Resource Management Gantt Chart
28 likes
152 uses

Event Planning Gantt Chart
14 likes
125 uses

Project Charter Template
2 likes
96 uses
Product Development Gantt Chart
7 likes
62 uses

Sales Strategy Gantt Chart
3 likes
61 uses

Construction Project Gantt Chart
14 likes
51 uses

Life & Purpose Radial Assessment Chart
14 likes
31 uses

Alignment Chart Template
0 likes
27 uses
T-Chart Template
0 likes
16 uses

Explore more
Architecture Diagram TemplatesAWS DiagramBPMNBusiness Technology Architect TemplatesChain of Command TemplatesChain of Command TemplatesCloud Architecture DiagramsConcept MapData MappingDecision TreeFishbone DiagramsFlowchartGantt ChartLogic ModelDiagramming & mappingMind MapsOrganizational ChartProcess & WorkflowProcess MapTechnical DiagramsUML DiagramsUse Case Diagram templatesValue Stream Mapping templatesVenn DiagramWork Breakdown Structure