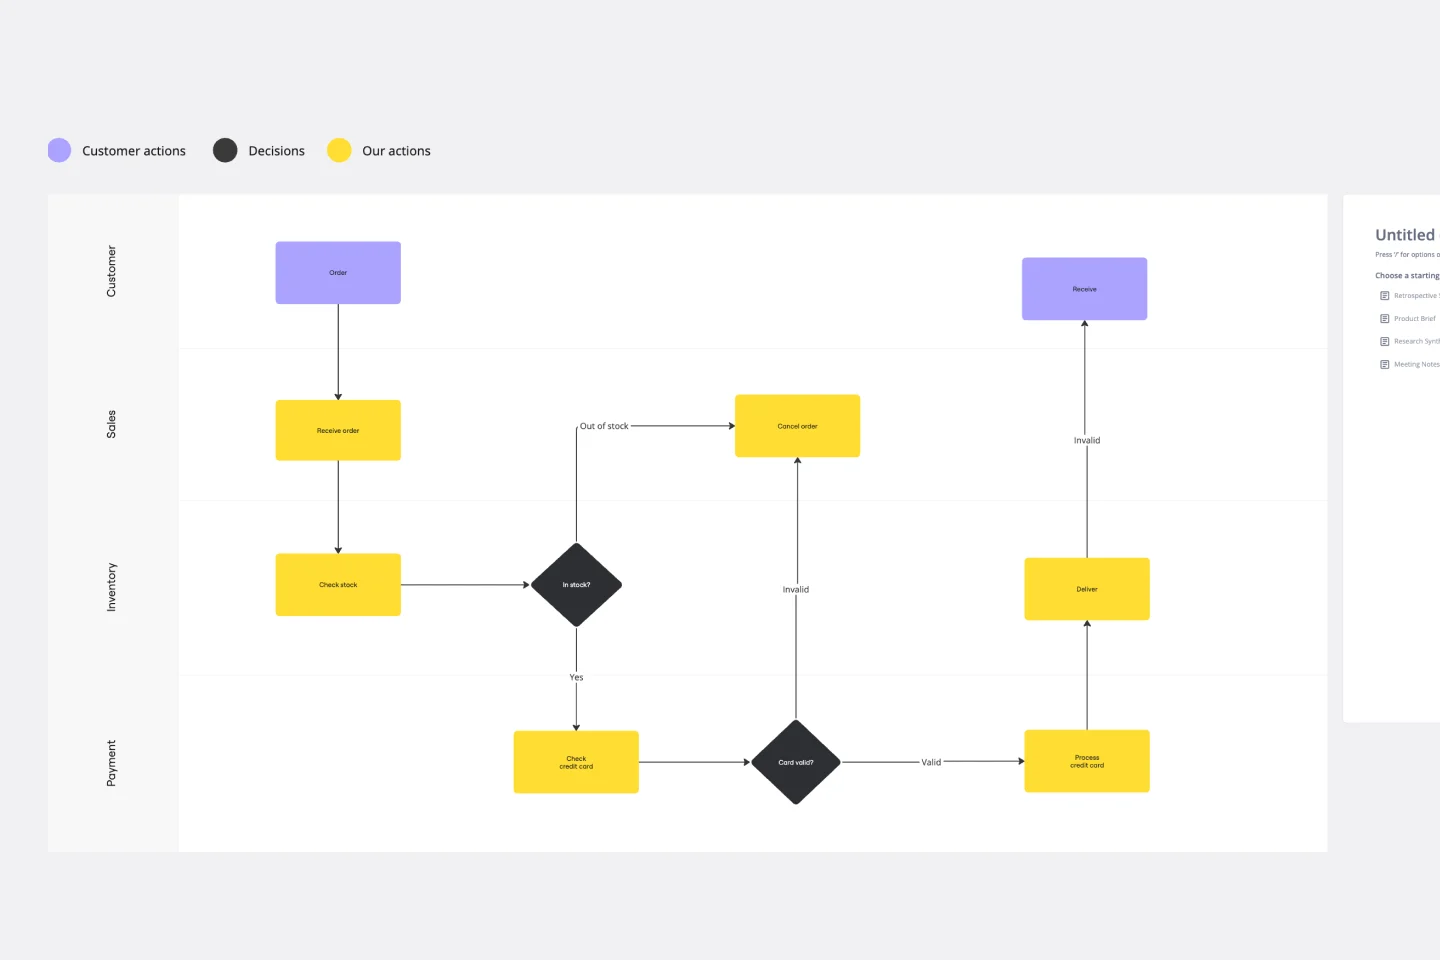
This swim lane diagram is a fundamental tool to any transactional process improvement. It allows you to visualize the process, understand the current state, and enables you to visualize a complex transactional process covering multiple roles and departments. The insights that you will gain while building this diagram as a team can be exceptionally meaningful.
This swim lane diagram will help you to:
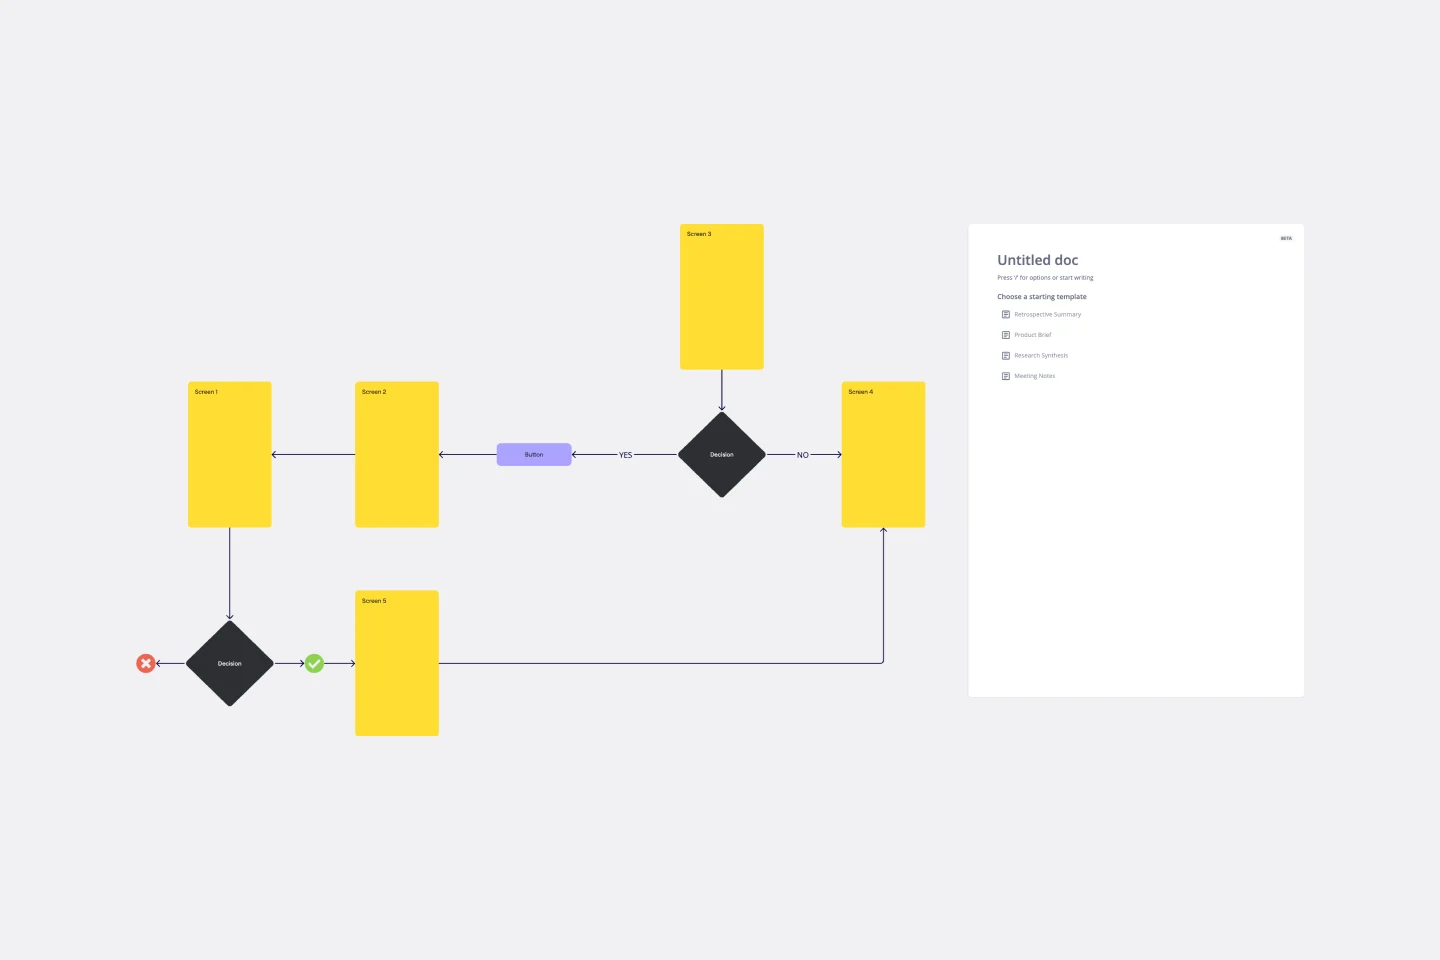
Clarify the process sequence
Capture process relevant data
Show the interrelationship of various steps in the process
Help identify deviations between the actual process and the intended process
Help isolate where in the process the problems are most likely to occur
Visually demonstrate the number of hand-offs between roles and/or departments
When evaluating your process document the current way things are actually done, not the ideal, to identify problems. This is accomplished by going to the actual place where the work is done and observing the actual work while talking to the individuals who perform the tasks. Do not take for granted that you know what happens. It is always important to go and see.

NEXT LEVEL Partners
Our Mission: Enable client PARTNERS to continuously outperform through deployment of NEXT LEVEL business, talent, and organizational processes.
Categories
Similar templates
Cross Functional (Swimlane) Chart

Cross Functional (Swimlane) Chart
The Cross Functional (Swimlane) Chart template offers a visual tool for mapping out processes or workflows with multiple stakeholders or functional areas. It provides swimlanes for organizing tasks and responsibilities by department or role. This template enables teams to visualize process flows, identify handoffs, and improve coordination and collaboration across functions. By promoting transparency and accountability, the Cross Functional (Swimlane) Chart empowers organizations to streamline workflows and drive cross-functional alignment effectively.
Cross-Functional Flowchart

Cross-Functional Flowchart
The Cross Functional Flowchart template is a visual tool for illustrating the sequence of steps and interactions between different departments or functional areas within an organization. It provides a structured framework for mapping out processes, identifying handoffs, and improving communication and collaboration. This template enables teams to visualize end-to-end processes, identify bottlenecks, and streamline workflows across functions. By promoting transparency and alignment, the Cross-Functional Flowchart empowers organizations to optimize processes and drive cross-functional collaboration effectively.
Business Modeling Techniques

User Flow Template
User Flow Template
User flows are diagrams that help UX and product teams map out the logical path a user should take when interacting with a system. As a visual tool, the user flow shows the relationship between a website or app’s functionality, potential actions a user could take, and the outcome of what the user decides to do. User flows help you understand what a user does to finish a task or complete a goal through your product or experience.
Production Flowchart Template
Production Flowchart Template
The Production Flowchart Template is a well-crafted tool that clearly represents a production process from start to finish. It breaks down complex procedures into easy-to-understand segments, making it easier for stakeholders to grasp the entire process. One of the key benefits of using this template is that it helps to clarify complex production pathways. By mapping out operations visually, teams can identify potential bottlenecks or inefficiencies, facilitating timely and well-informed decision-making.
121 Kanban

121 Kanban
121 Kanban template streamlines task management by providing a structured framework for prioritization and execution. It encourages a focused approach to task completion by limiting work in progress (WIP) and promoting collaboration between team members. With clear visualization of tasks and progress, teams can maintain workflow balance and deliver high-quality results efficiently.
Swimlane Diagram Template
Swimlane Diagram Template
A swimlane diagram shows you which stakeholders are responsible for each area of your critical processes. You can use it to understand current processes or plan new ones.
Cross Functional (Swimlane) Chart
Cross Functional (Swimlane) Chart
The Cross Functional (Swimlane) Chart template offers a visual tool for mapping out processes or workflows with multiple stakeholders or functional areas. It provides swimlanes for organizing tasks and responsibilities by department or role. This template enables teams to visualize process flows, identify handoffs, and improve coordination and collaboration across functions. By promoting transparency and accountability, the Cross Functional (Swimlane) Chart empowers organizations to streamline workflows and drive cross-functional alignment effectively.
Cross-Functional Flowchart
Cross-Functional Flowchart
The Cross Functional Flowchart template is a visual tool for illustrating the sequence of steps and interactions between different departments or functional areas within an organization. It provides a structured framework for mapping out processes, identifying handoffs, and improving communication and collaboration. This template enables teams to visualize end-to-end processes, identify bottlenecks, and streamline workflows across functions. By promoting transparency and alignment, the Cross-Functional Flowchart empowers organizations to optimize processes and drive cross-functional collaboration effectively.
Business Modeling Techniques
User Flow Template
User Flow Template
User flows are diagrams that help UX and product teams map out the logical path a user should take when interacting with a system. As a visual tool, the user flow shows the relationship between a website or app’s functionality, potential actions a user could take, and the outcome of what the user decides to do. User flows help you understand what a user does to finish a task or complete a goal through your product or experience.
Production Flowchart Template
Production Flowchart Template
The Production Flowchart Template is a well-crafted tool that clearly represents a production process from start to finish. It breaks down complex procedures into easy-to-understand segments, making it easier for stakeholders to grasp the entire process. One of the key benefits of using this template is that it helps to clarify complex production pathways. By mapping out operations visually, teams can identify potential bottlenecks or inefficiencies, facilitating timely and well-informed decision-making.
121 Kanban
121 Kanban
121 Kanban template streamlines task management by providing a structured framework for prioritization and execution. It encourages a focused approach to task completion by limiting work in progress (WIP) and promoting collaboration between team members. With clear visualization of tasks and progress, teams can maintain workflow balance and deliver high-quality results efficiently.
Swimlane Diagram Template
Swimlane Diagram Template
A swimlane diagram shows you which stakeholders are responsible for each area of your critical processes. You can use it to understand current processes or plan new ones.