About the Strategic Group Mapping Template
We know that in the complex landscape of business strategy, it's crucial to have tools that can simplify our processes and offer clarity. Enter Miro's Strategic Group Mapping Template - designed to help you visually represent the competitive positions of different companies or products in your market.
What's a Strategic Group Mapping Template?
A Strategic Group Mapping Template is a visual tool that helps you plot out the competitive position of various entities within a market based on specific criteria. You can gain insights into market positions, potential market spaces, and competition intensity by placing competitors into different strategic groups based on key dimensions such as price range or product quality.
What are the benefits of using a Strategic Group Mapping Template?
Visual representation: By mapping competitors on a visual workspace, businesses can quickly identify clusters of similar competitors and gaps in the market.
Informed decision-making: It provides a clearer picture of where your business stands, aiding in more strategic decisions regarding market entry or product development.
Facilitates collaboration: As a shared template, teams can collaborate in real time, brainstorming and drawing insights together.
Enhances competitive analysis: Enables companies to identify potential threats or opportunities by visualizing where competitors are clustered and where market spaces are less dense.
How to use a Strategic Group Mapping Template in Miro?
Miro is flexible and interactive, making it a perfect place for strategic mapping. Here's how you can create one:
Open a new board: Select the Strategic Group Mapping Template in the Templates Library.
Use shapes: Edit the shapes on the template, or add more from Miro's shapes library. For your X and Y axis criteria, you can use lines and label them appropriately. Drag circles, rectangles, or other shapes to represent different companies or products.
Customize and position: Adjust the size, colors, and positions of shapes based on the relative position of competitors. The drag-and-drop feature ensures ease of positioning.
Collaborate: Invite team members to join your board and input their insights, ensuring a comprehensive mapping.
Discover more competitive analysis examples that you can use right away.
Strategic Group Mapping FAQs
What criteria should I use for the axes on the map?
It varies by industry and what you're analyzing. Common criteria include price, quality, market share, product range, and geographical coverage.
How often should I update my strategic group map?
It's essential to update your map periodically, especially when there are significant market changes, new entrants, or shifts in competitor strategies.
Can multiple team members edit the map simultaneously?
Yes, Miro allows real-time collaboration, so multiple members can edit, comment, and brainstorm together on the same map.

Miro
Your virtual workspace for innovation
Miro is an innovation workspace designed for teams of every size, everywhere, to dream, design, and build the future together. Our mission? To empower these teams to create the next big thing, powered by AI at every step of the way. Over 90 million users around the world rely on Miro to untangle complex ideas, put customer needs first, and deliver products and services faster. All supported by best-in-class security, compliance, and scalability.
Categories
Similar templates
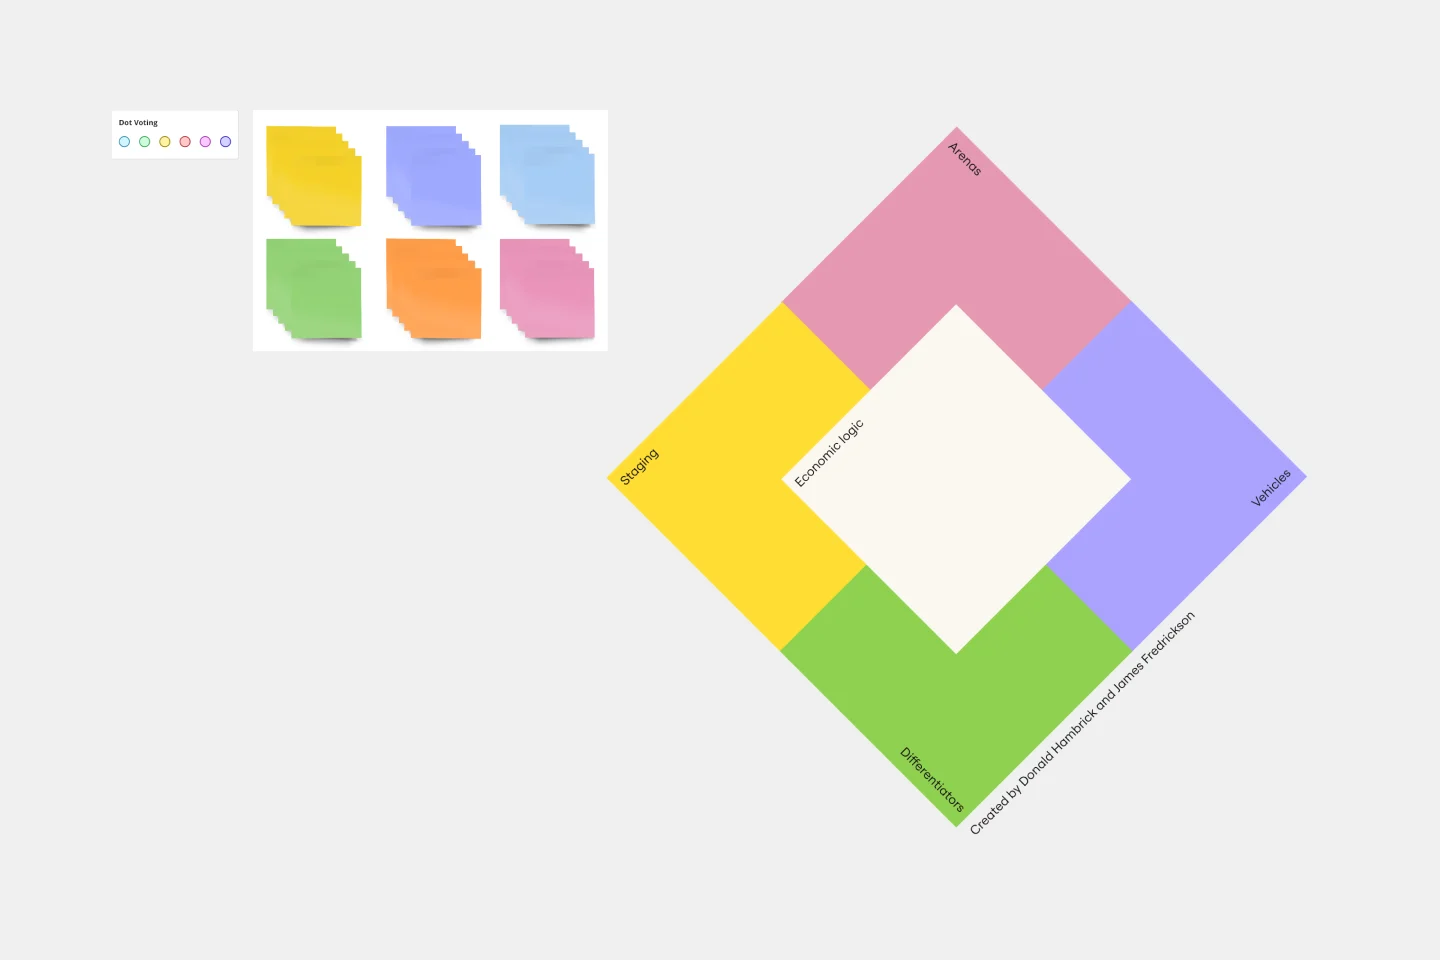
Strategy Diamond Template
Strategy Diamond Template
To achieve key objectives, every business assembles a series of strategies. But what elements should you consider when building a strategy? A strategy diamond is a collection of elements forming a coherent business strategy. These elements include: Arenas, Differentiators, Vehicles, Staging, and Economic Logic. Most strategic plans focus on just one or two of these elements, creating gaps that might cause problems for your business later on. A strategy diamond can help you stay focused and ensure you’re fulfilling all of your business’s needs rather than one or two.
Product Positioning Template
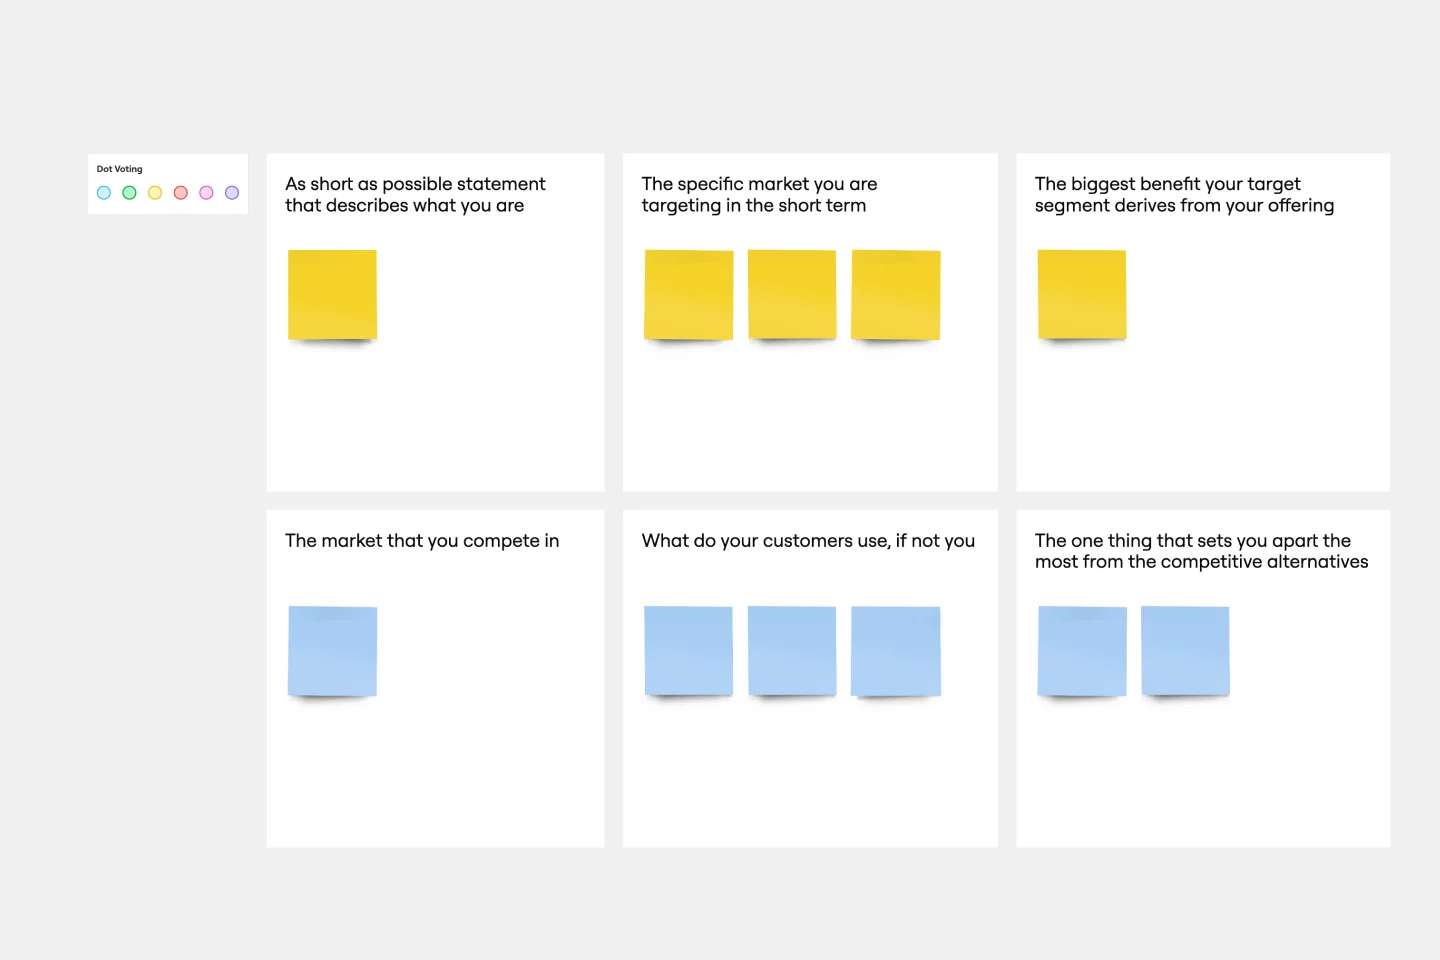
Product Positioning Template
For better or for worse, your company’s chances for success hinge partially on your market. As such, before you start building products and planning strategies, it’s a good idea to conduct a product positioning exercise. A product positioning exercise is designed to situate your company and your offering within a market. The product positioning template guides you to consider key topics such as defining your product and market category, identifying your target segment and competitors, and understanding your key benefits and differentiation.
Porter's Five Forces Template
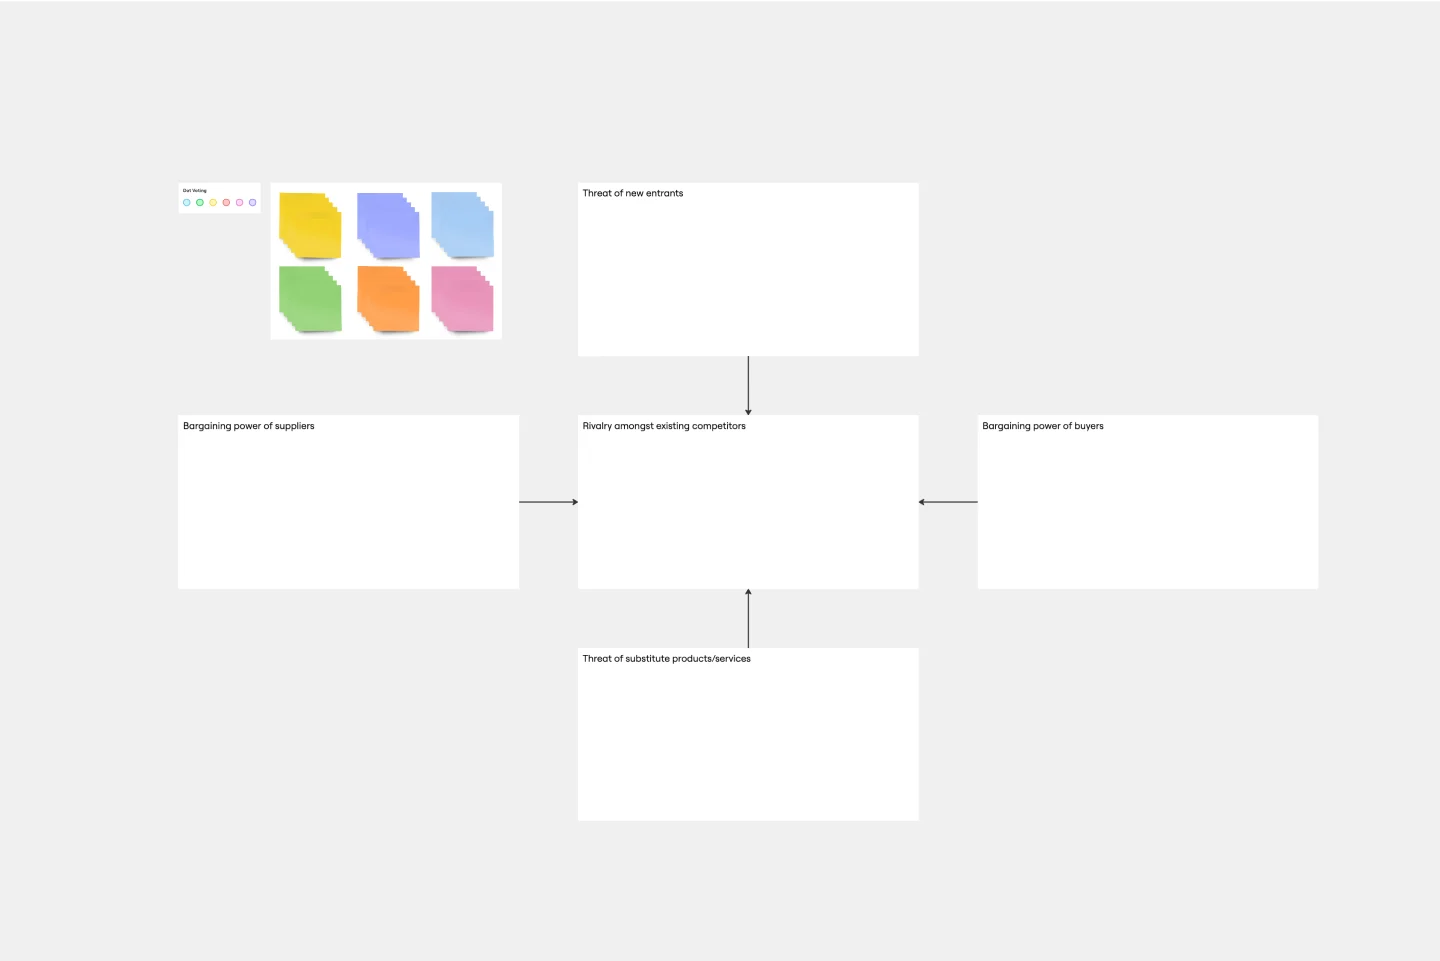
Porter's Five Forces Template
Developed by Harvard Business School professor Michael Porter, Porter’s Five Forces has become one of the most popular and highly regarded business strategy tools available for teams. Use Porter’s Five Forces to measure the strength of your current competition and decide which markets you might be able to move into. Porter’s Five Forces include: supplier power, buyer power, rivalry among existing competitors, the threat of substitute products or services, the threat of substitute products and services, and the threat of new entrants.
Innovation Matrix Template
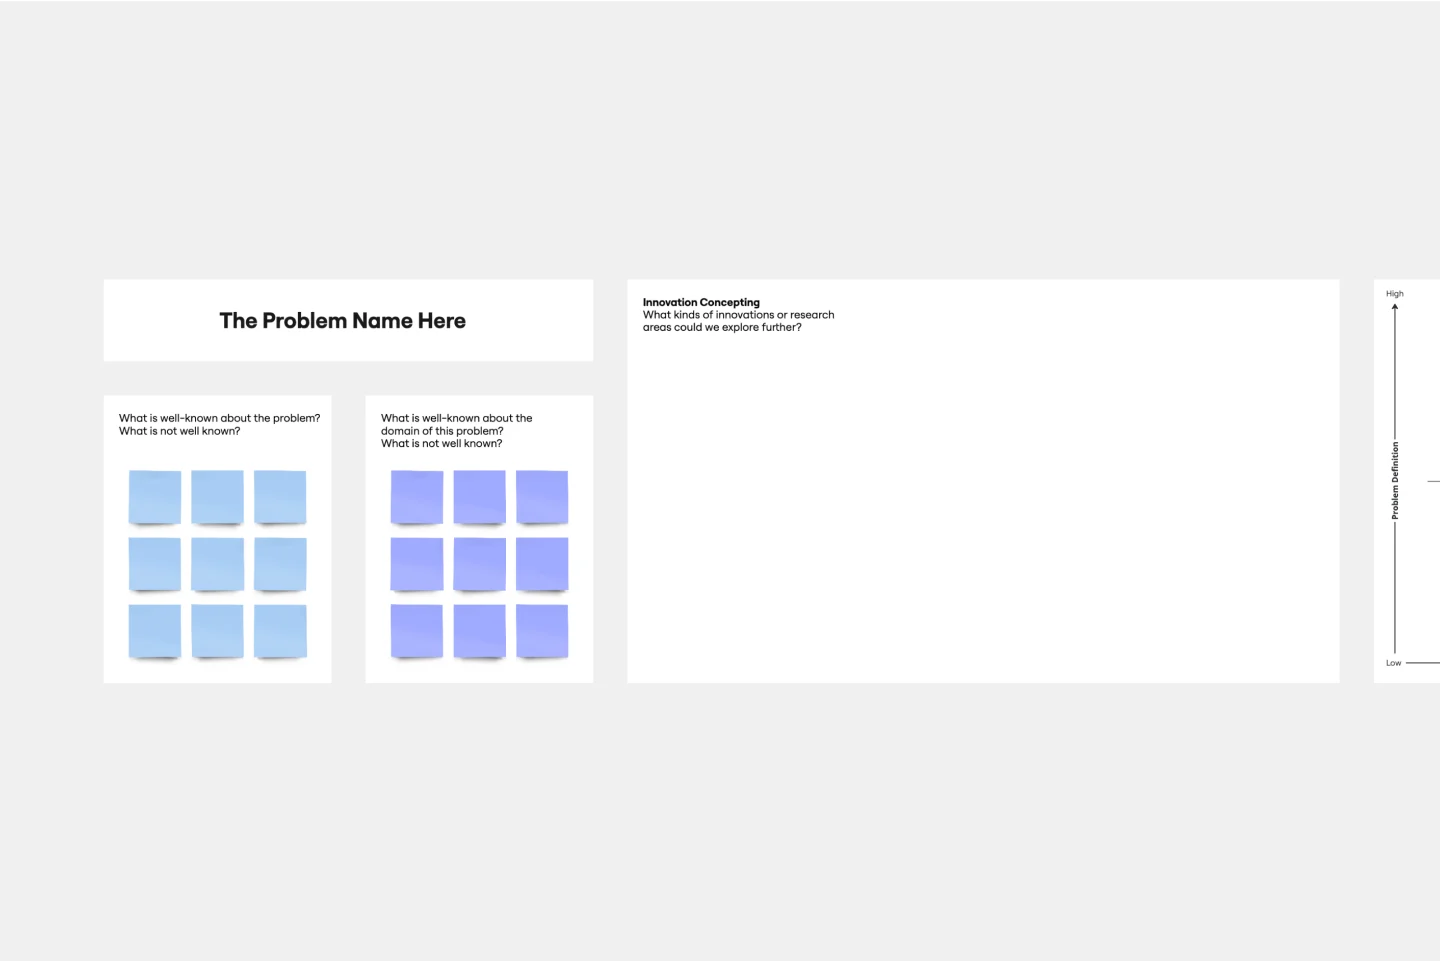
Innovation Matrix Template
Visualize the best way to grow your business with this Innovation Matrix template. It’ll show you how to streamline your innovation, make the right decisions about which areas of your business to innovate, and manage the entire process. So if you want to figure out the best way to innovate in your business, an innovation matrix can help.
Rebranding Presentation
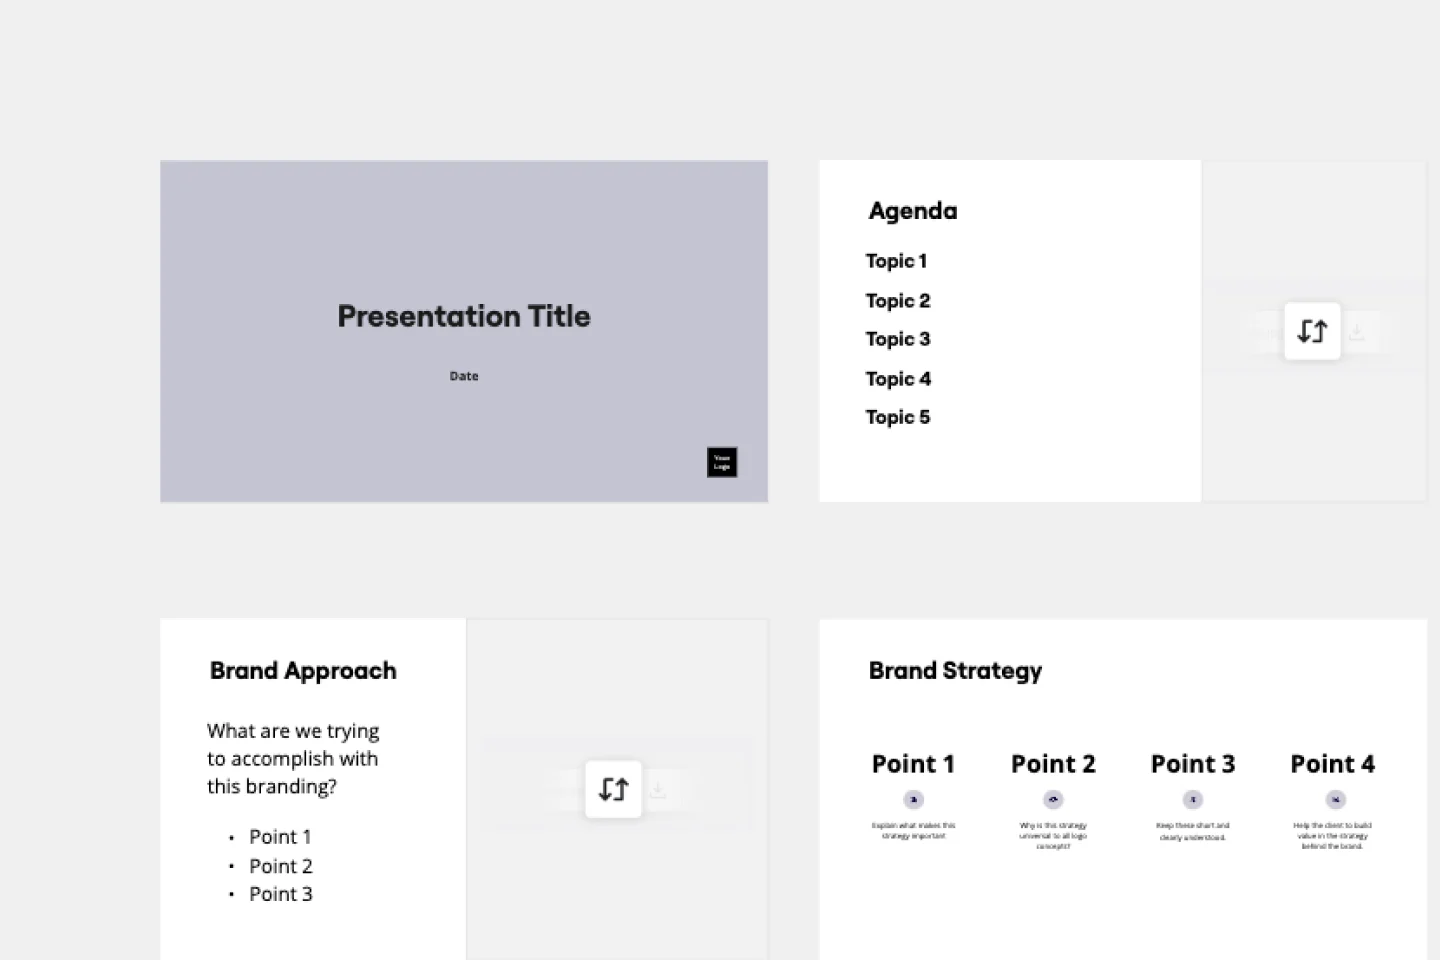
Rebranding Presentation
Out with the old, in with the new! Showcase your brand’s newly revised strategy with this dynamic Rebranding Presentation Template.
Strategy Diamond Template
Strategy Diamond Template
To achieve key objectives, every business assembles a series of strategies. But what elements should you consider when building a strategy? A strategy diamond is a collection of elements forming a coherent business strategy. These elements include: Arenas, Differentiators, Vehicles, Staging, and Economic Logic. Most strategic plans focus on just one or two of these elements, creating gaps that might cause problems for your business later on. A strategy diamond can help you stay focused and ensure you’re fulfilling all of your business’s needs rather than one or two.
Product Positioning Template
Product Positioning Template
For better or for worse, your company’s chances for success hinge partially on your market. As such, before you start building products and planning strategies, it’s a good idea to conduct a product positioning exercise. A product positioning exercise is designed to situate your company and your offering within a market. The product positioning template guides you to consider key topics such as defining your product and market category, identifying your target segment and competitors, and understanding your key benefits and differentiation.
Porter's Five Forces Template
Porter's Five Forces Template
Developed by Harvard Business School professor Michael Porter, Porter’s Five Forces has become one of the most popular and highly regarded business strategy tools available for teams. Use Porter’s Five Forces to measure the strength of your current competition and decide which markets you might be able to move into. Porter’s Five Forces include: supplier power, buyer power, rivalry among existing competitors, the threat of substitute products or services, the threat of substitute products and services, and the threat of new entrants.
Innovation Matrix Template
Innovation Matrix Template
Visualize the best way to grow your business with this Innovation Matrix template. It’ll show you how to streamline your innovation, make the right decisions about which areas of your business to innovate, and manage the entire process. So if you want to figure out the best way to innovate in your business, an innovation matrix can help.
Rebranding Presentation
Rebranding Presentation
Out with the old, in with the new! Showcase your brand’s newly revised strategy with this dynamic Rebranding Presentation Template.