About the Cost Benefit Analysis Template
What is a cost benefit analysis?
Every business decision comes with potential rewards, as well as potential risks. Your decision might expand the business, introduce a new product, or tap into a new supply chain, but it also might cost the organization precious time, money, or social capital. Without a systematic way of analyzing costs and benefits, you may find making decisions an arduous task.
Cost benefit analysis (CBA) is an analytical tool that helps your team assess the pros and cons of moving forward with a business proposal. This technique helps you decide the best course of action to take with a new project by analyzing each option.
When to use a cost benefit analysis
You can use a CBA to compare completed or potential processes, or to estimate the value against the risks of decisions, projects, or processes. Your team can use this powerful, efficient tool in commercial transactions, business decisions, and project investments.
Advantages of using a cost benefit analysis
Organizations make high-stakes choices all the time. Chances are high that your competition is weighing many of the same factors that you are. That’s why it’s crucial to approach decisions in a systematic, methodical way.
A cost benefit analysis allows you to weigh the potential costs of a decision without having to actually incur those costs. It helps your team decide whether the benefits outweigh the costs. If you have no choice but to incur costs, the analysis can provide an estimate for the time it will take to repay those costs.
Perform your own cost benefit analysis
Miro’s whiteboard tool is the perfect canvas to create and share your team’s cost benefit analysis. Get started by selecting this Cost Benefit Analysis Template. Then, follow these steps:
Step 1: Brainstorm costs and benefits. Make a list of each. Try to think of unexpected costs or benefits that your team might not have immediately anticipated. Once you have a list of costs and benefits, think about whether those costs and benefits are likely to change or grow over time.
Step 2: Figure out the monetary value of the costs. Will you need to hire employees? Train them? Will you experience a decrease in productivity while new hires get up to speed? If you introduce a new feature, will your system experience an outage that impacts your customers
Step 3: Now assign a monetary value to the benefits. Do your best to estimate potential revenue, but don’t confine yourself to cash. Think about “soft” benefits like positive word-of-mouth, employee satisfaction, or environmental preservation.
Step 4: Compare your costs and benefits. Which seems greater? How long would it take to repay any costs?

Miro
Your virtual workspace for innovation
Miro is an innovation workspace designed for teams of every size, everywhere, to dream, design, and build the future together. Our mission? To empower these teams to create the next big thing, powered by AI at every step of the way. Over 90 million users around the world rely on Miro to untangle complex ideas, put customer needs first, and deliver products and services faster. All supported by best-in-class security, compliance, and scalability.
Categories
Similar templates
User Story Map Template

User Story Map Template
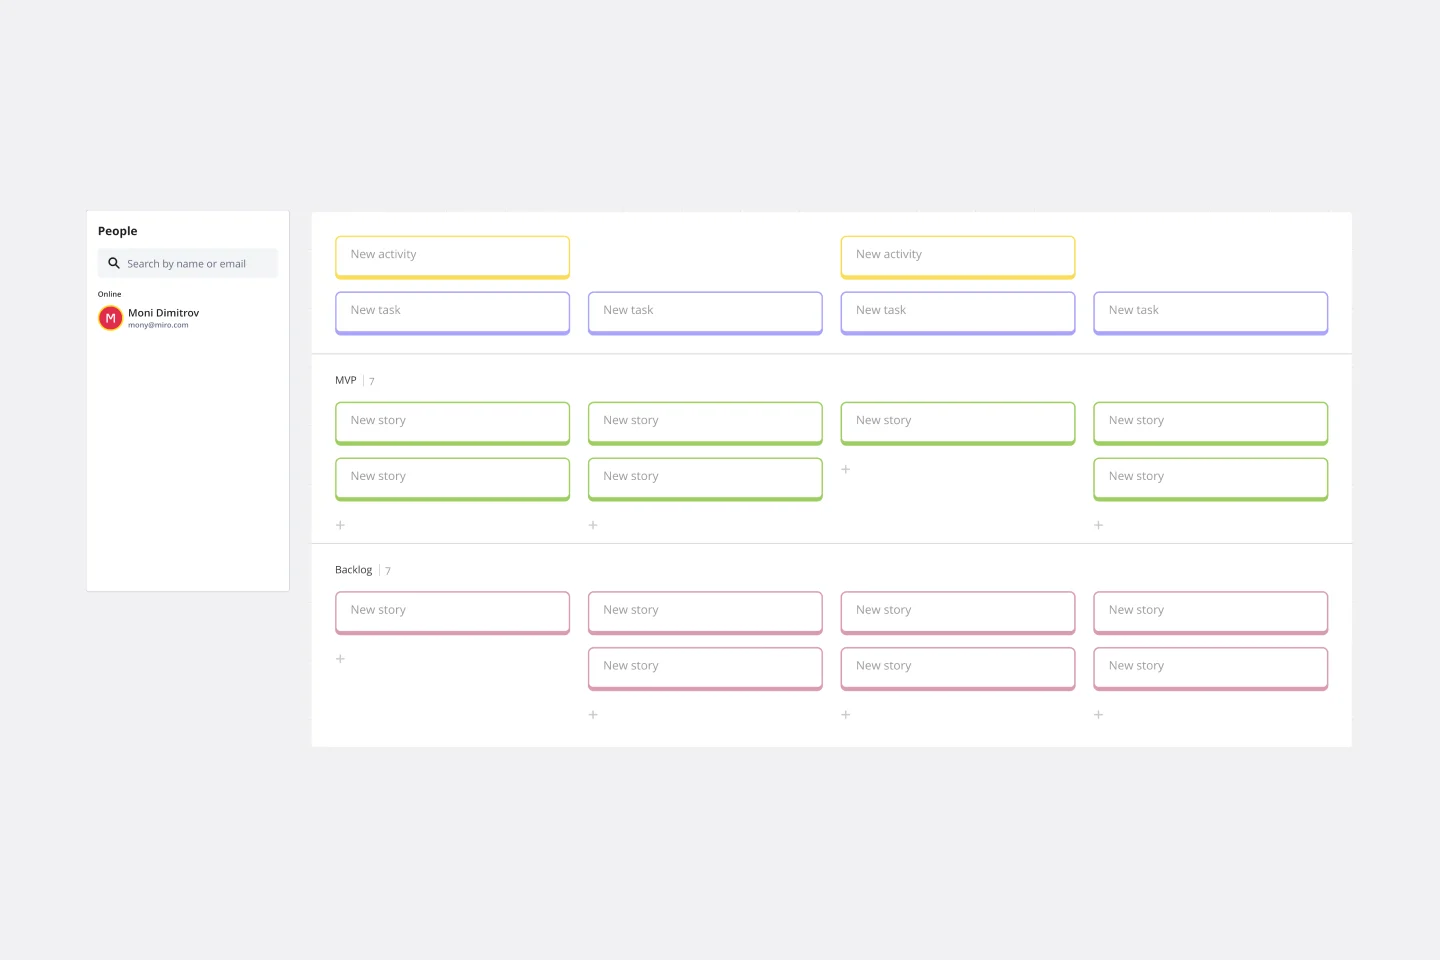
Popularized by Jeff Patton in 2005, the user story mapping technique is an agile way to manage product backlogs. Whether you’re working alone or with a product team, you can leverage user story mapping to plan product releases. User story maps help teams stay focused on the business value and release features that customers care about. The framework helps to get a shared understanding for the cross-functional team of what needs to be done to satisfy customers' needs.
Features Audit Template

Features Audit Template
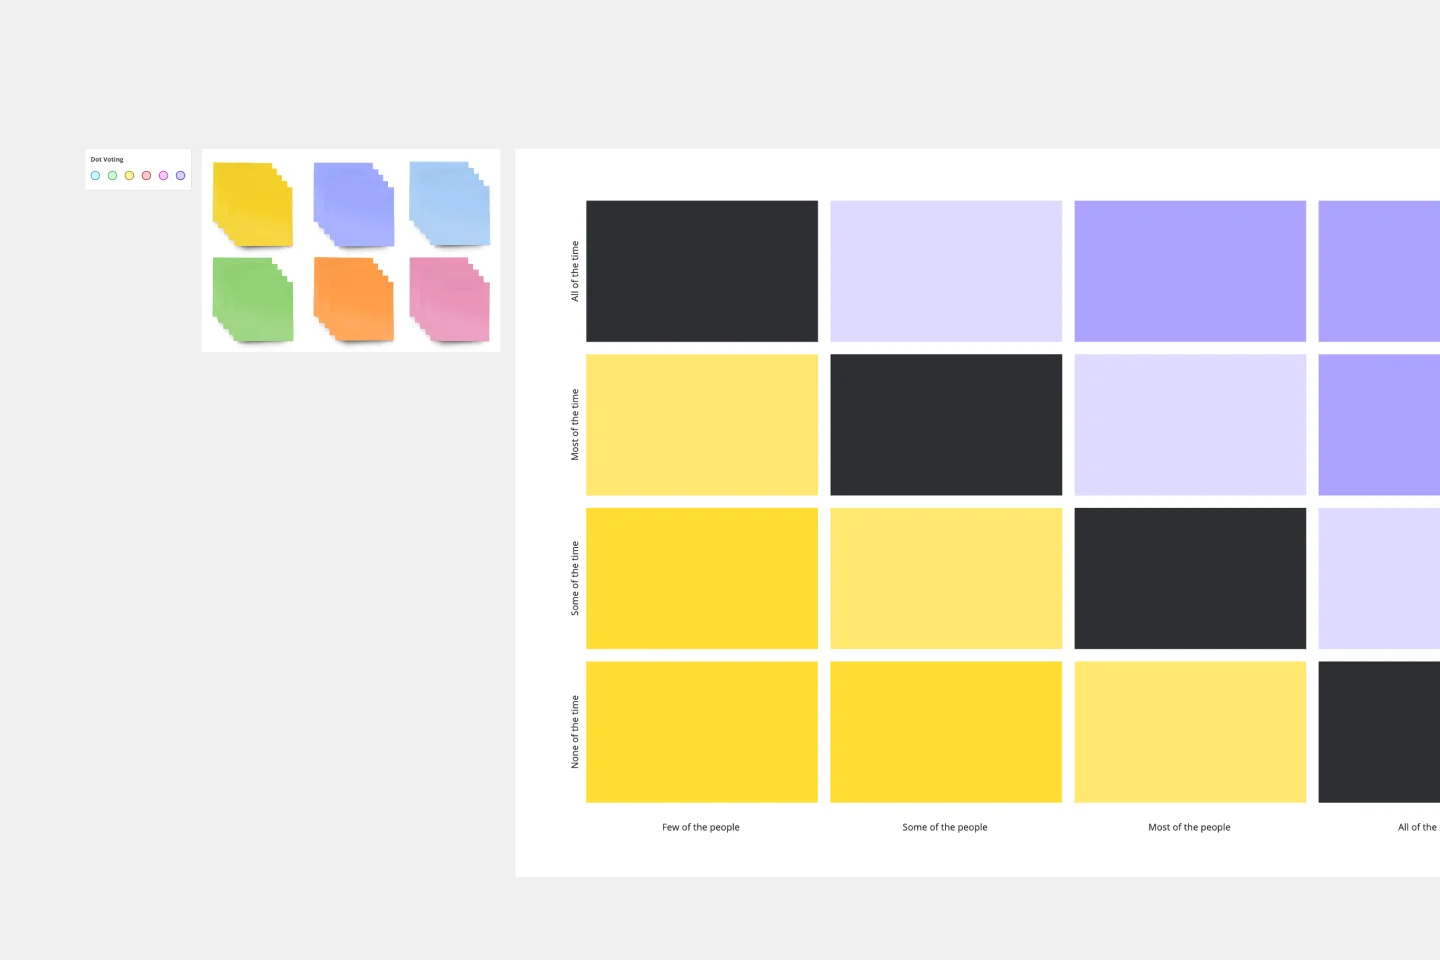
Add new features or improve existing features—those are the two paths toward improving a product. But which should you take? A features audit will help you decide. This easy, powerful product management tool will give you a way to examine all of your features, then gather research and have detailed discussions about the ones that simply aren’t working. Then you can decide if you should increase those features’ visibility or the frequency with which it’s used—or if you should remove it altogether.
Feature Canvas Template

Feature Canvas Template
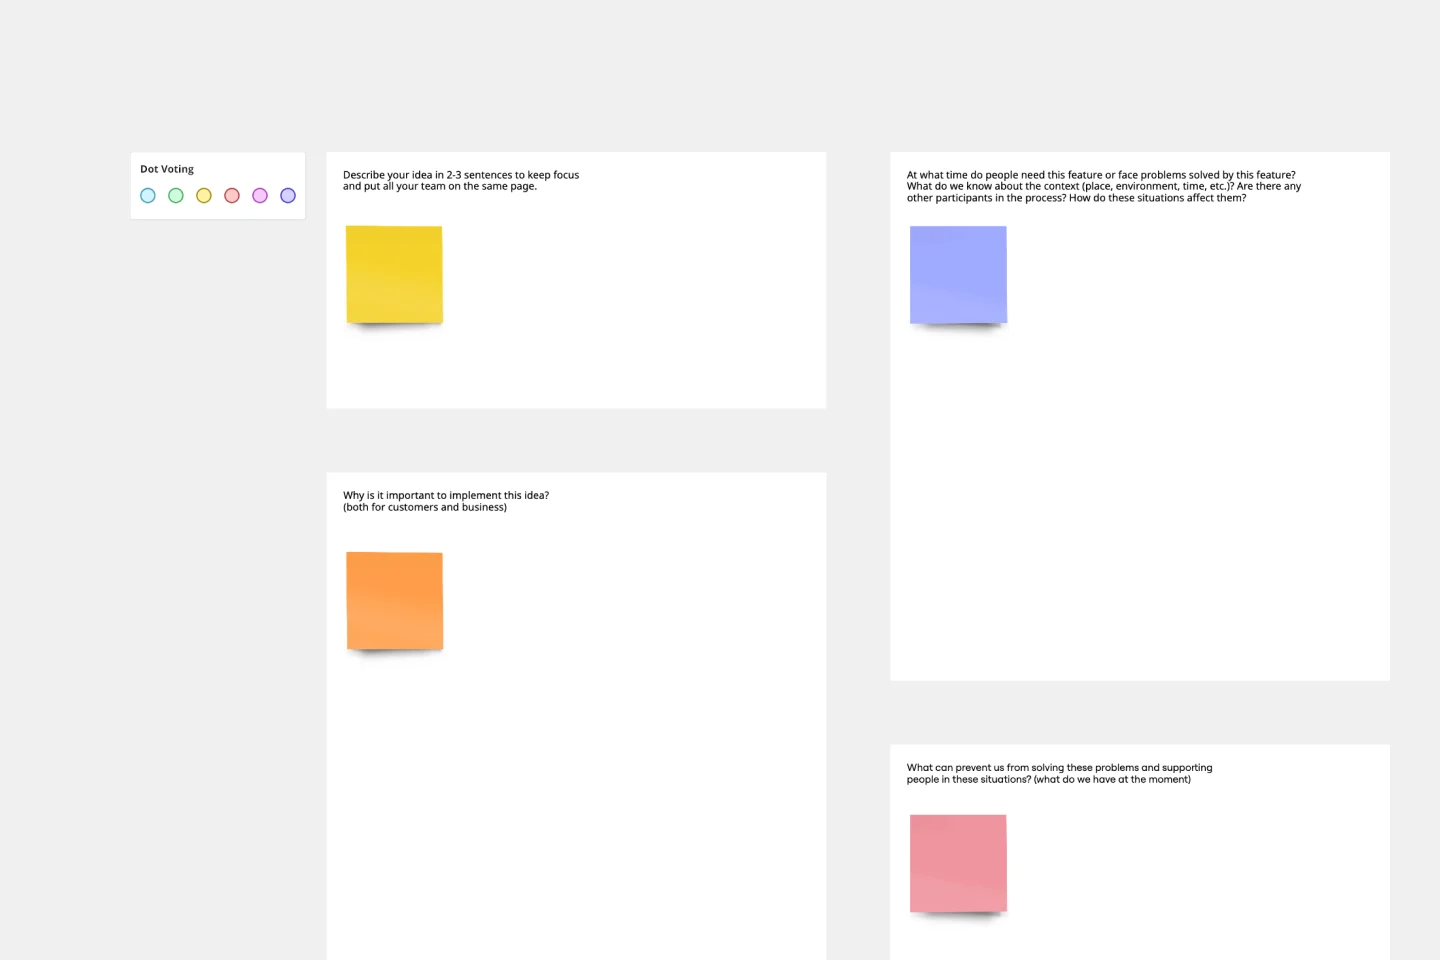
When you’re working on a new feature that solves a problem for your users, it’s easy to dive right in and start looking for solutions. However, it’s important to understand the initial user problem first. Use the Feature Canvas template to do a deep-dive into the user’s problems, the context in which they will use your feature, and the value proposition you will deliver to your users. The template enables you to spend more time exploring the problem to anticipate any potential blind spots before jumping into solutions mode.
User Story Map Template

User Story Map Template
Popularized by Jeff Patton in 2005, the user story mapping technique is an agile way to manage product backlogs. Whether you’re working alone or with a product team, you can leverage user story mapping to plan product releases. User story maps help teams stay focused on the business value and release features that customers care about. The framework helps to get a shared understanding for the cross-functional team of what needs to be done to satisfy customers' needs.
Features Audit Template

Features Audit Template
Add new features or improve existing features—those are the two paths toward improving a product. But which should you take? A features audit will help you decide. This easy, powerful product management tool will give you a way to examine all of your features, then gather research and have detailed discussions about the ones that simply aren’t working. Then you can decide if you should increase those features’ visibility or the frequency with which it’s used—or if you should remove it altogether.
Feature Canvas Template

Feature Canvas Template
When you’re working on a new feature that solves a problem for your users, it’s easy to dive right in and start looking for solutions. However, it’s important to understand the initial user problem first. Use the Feature Canvas template to do a deep-dive into the user’s problems, the context in which they will use your feature, and the value proposition you will deliver to your users. The template enables you to spend more time exploring the problem to anticipate any potential blind spots before jumping into solutions mode.