Watch the video

Stephen Stouffer
Director, Automation Solutions @ Tray.io
I'm Stephen Stouffer, an admin turned SaaS executive 🚀, navigating the dynamic landscape of RevOps 🤓 and AI 🧠. With a passion for automation ⚙️ and integration 🔗, I streamline processes and architect efficient SaaS systems. When the screens go off, you'll find me savoring my love for coffee ☕, often brewing my most innovative ideas.
Categories
Similar templates
4x4 Change Acceleration
58 likes
152 uses

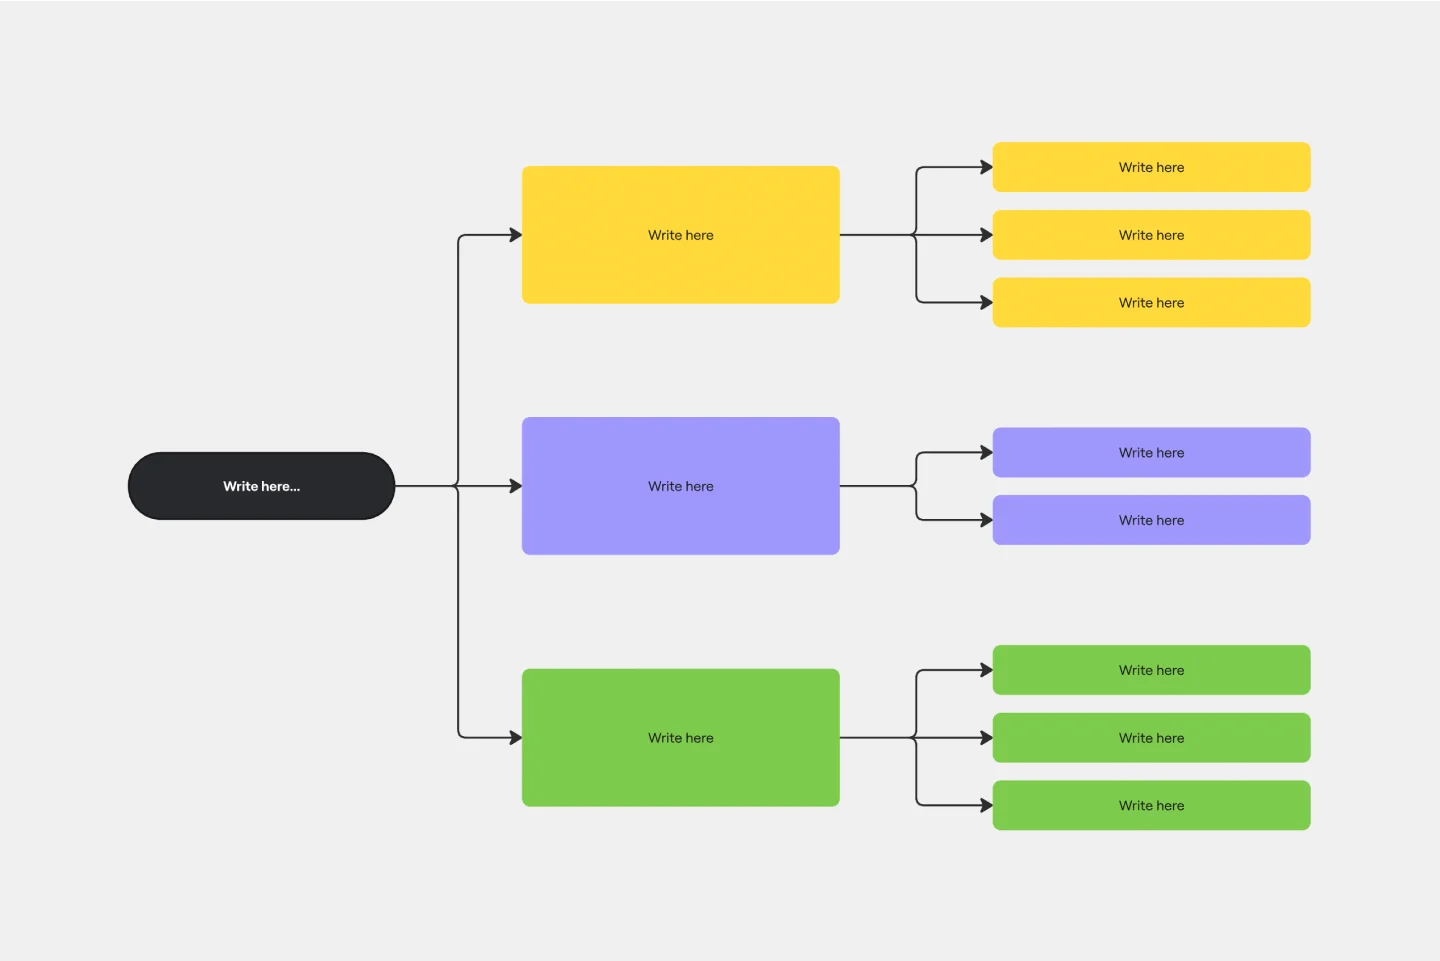
Brace Map Template
0 likes
479 uses
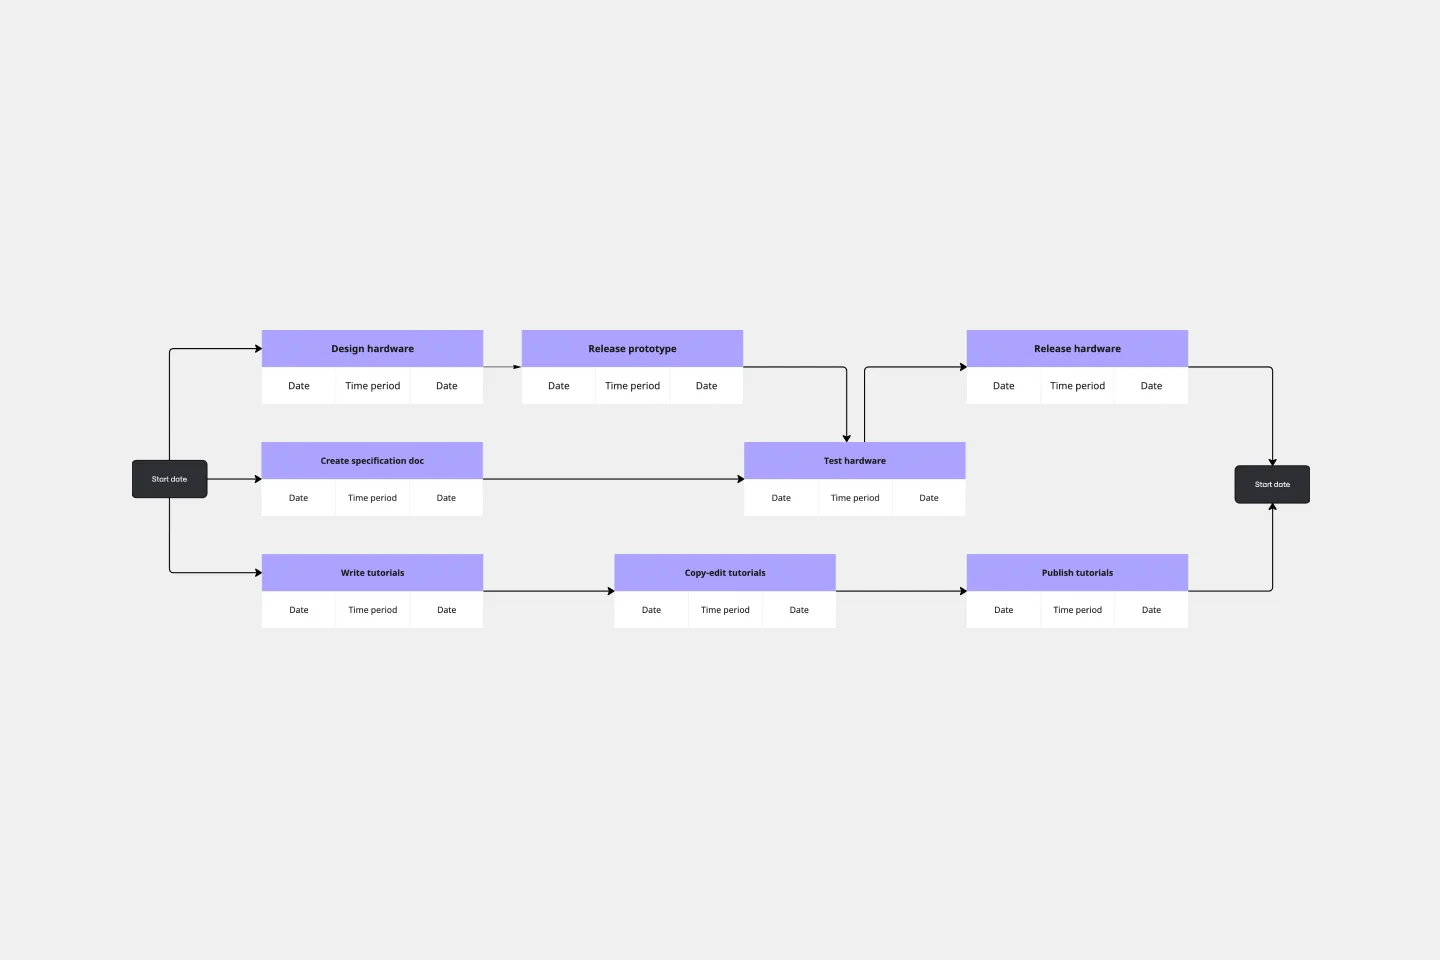
PERT Chart Template
1 likes
297 uses
UML ERD Diagram
17 likes
113 uses

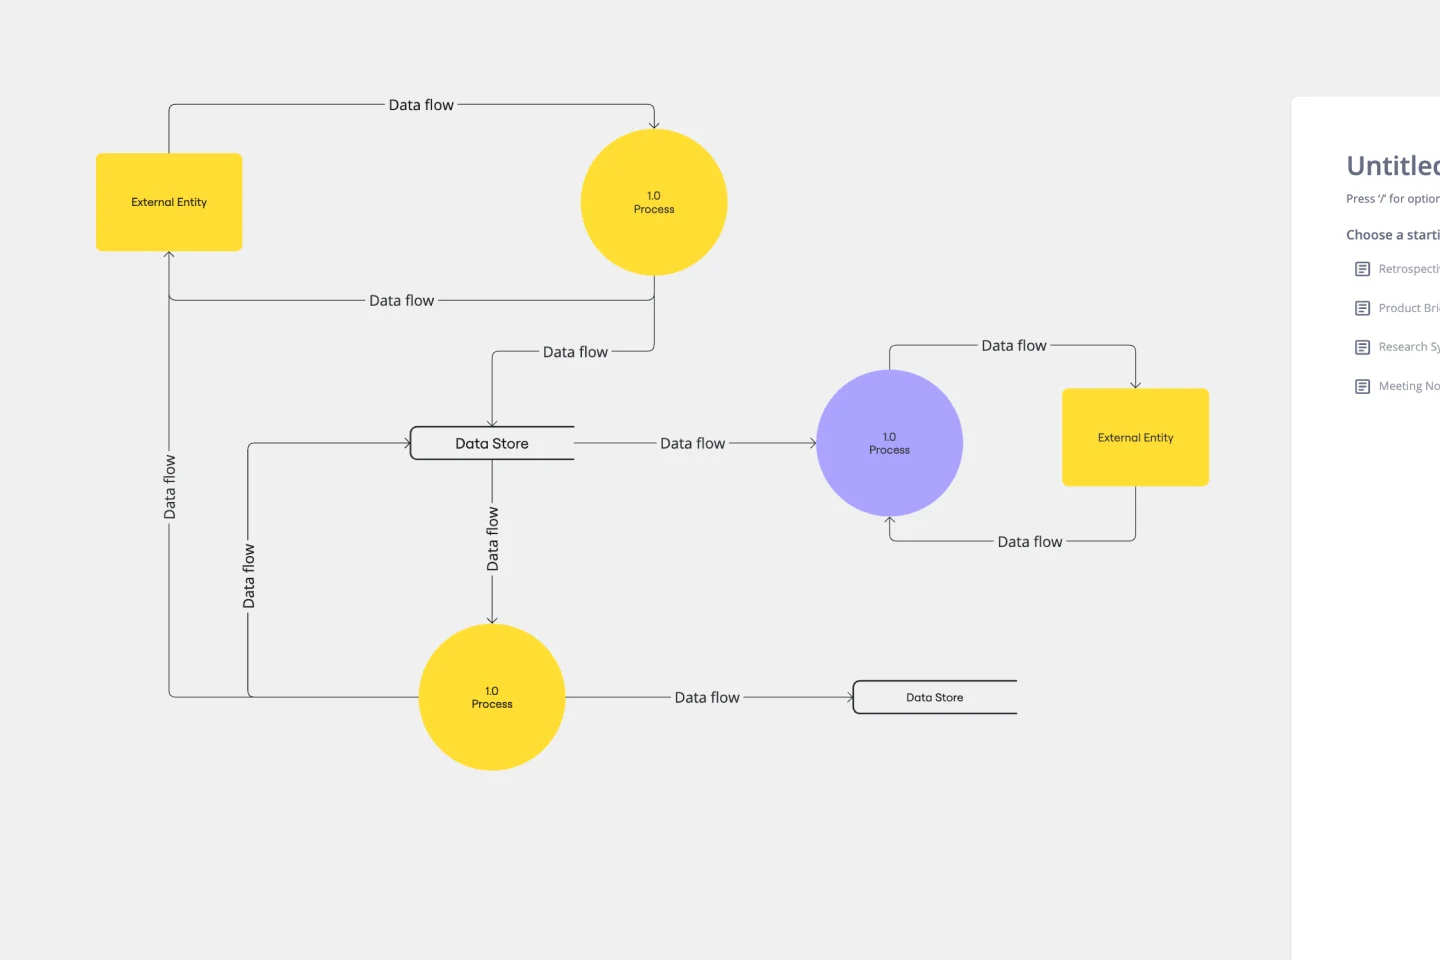
Data Flow Diagram Template
3 likes
340 uses
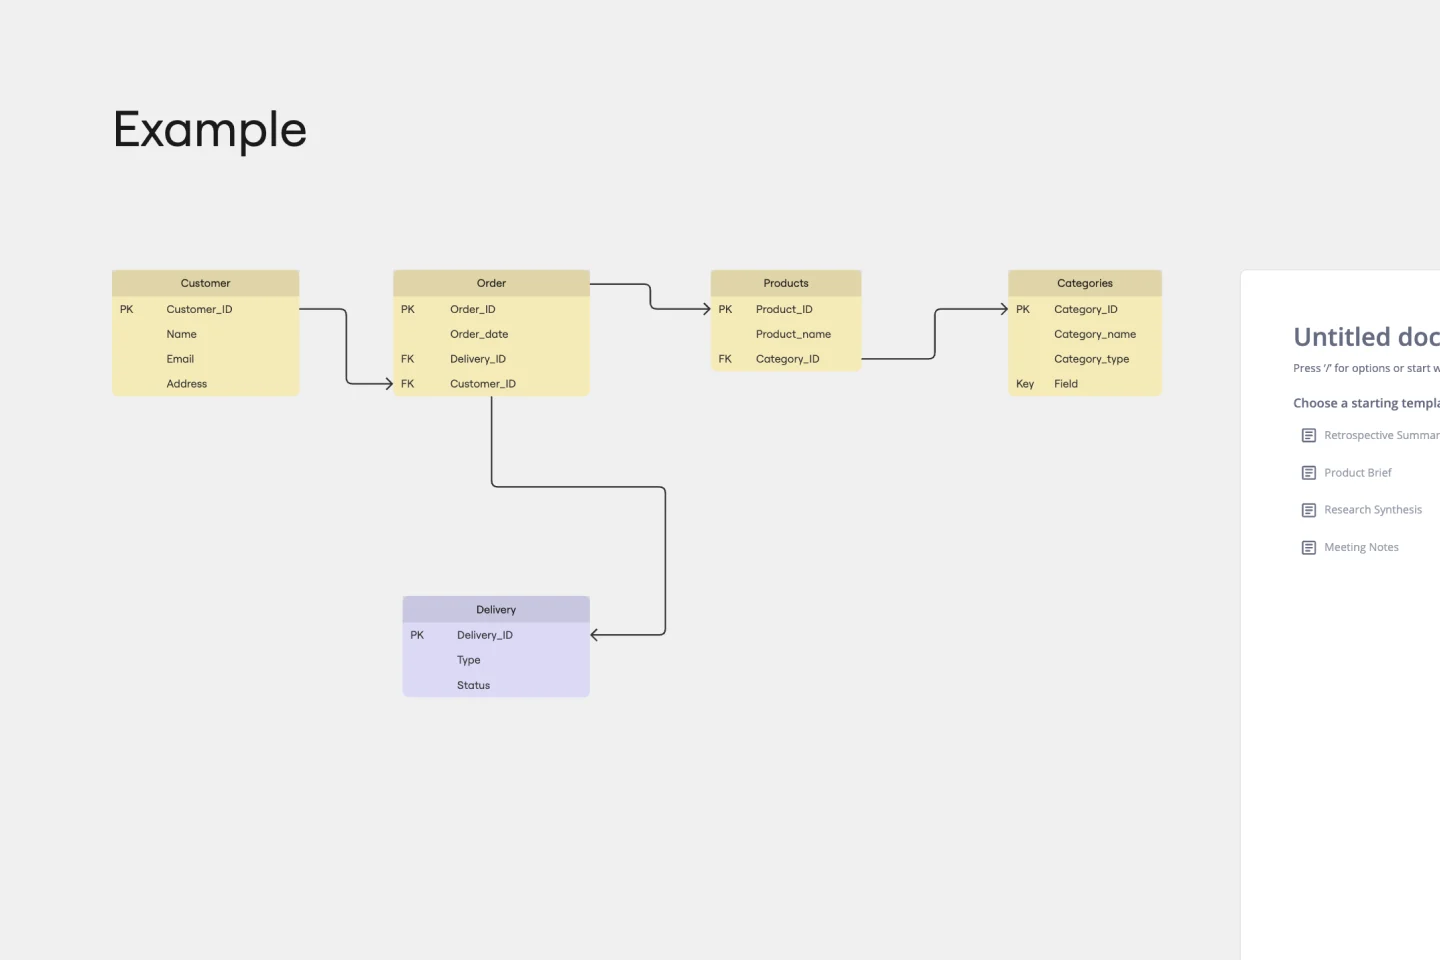
Entity Relationship Diagram Template
11 likes
925 uses
4x4 Change Acceleration
58 likes
152 uses
Brace Map Template
0 likes
479 uses
PERT Chart Template
1 likes
297 uses
UML ERD Diagram
17 likes
113 uses
Data Flow Diagram Template
3 likes
340 uses
Entity Relationship Diagram Template
11 likes
925 uses