A project management workflow is a sequence of tasks that need to be completed in order for a team or individual to complete a project, reach a goal, or finish a process step.
It’s a way of breaking down complex processes and projects into smaller steps and then sequencing those steps in a logical order that allows all parties to complete their tasks successfully.
Having good project management workflows in place is key for project managers and leaders who want to see work get done without stoppages, arguments, waiting on dependencies, or confusion about who does what and when.
In other words, if you want your teams to run smoothly and face fewer snags along the path toward project execution, you need to provide project management workflows to those teams.

Categories
Similar templates
2-Circle Venn Diagram Template
2-Circle Venn Diagram Template
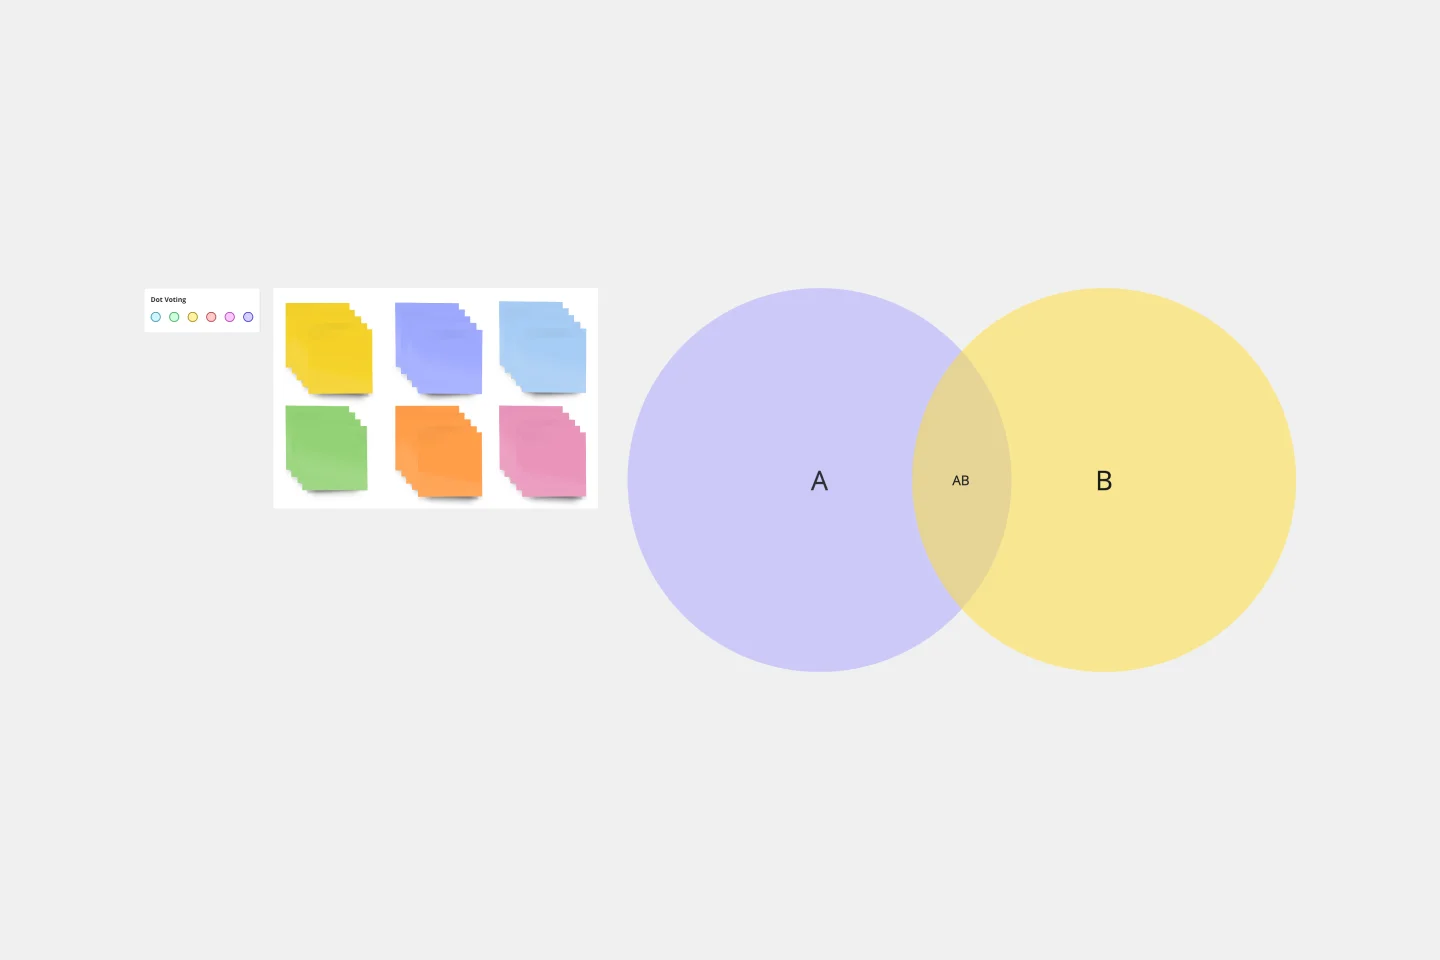
The 2 Circle Venn Diagram Template is a dynamic, intuitive tool designed to represent the logical relationships between two data sets visually. For teams, this template proves valuable in enabling efficient collaboration, clear communication, and shared understanding.
Product Development Flowchart Template
Product Development Flowchart Template
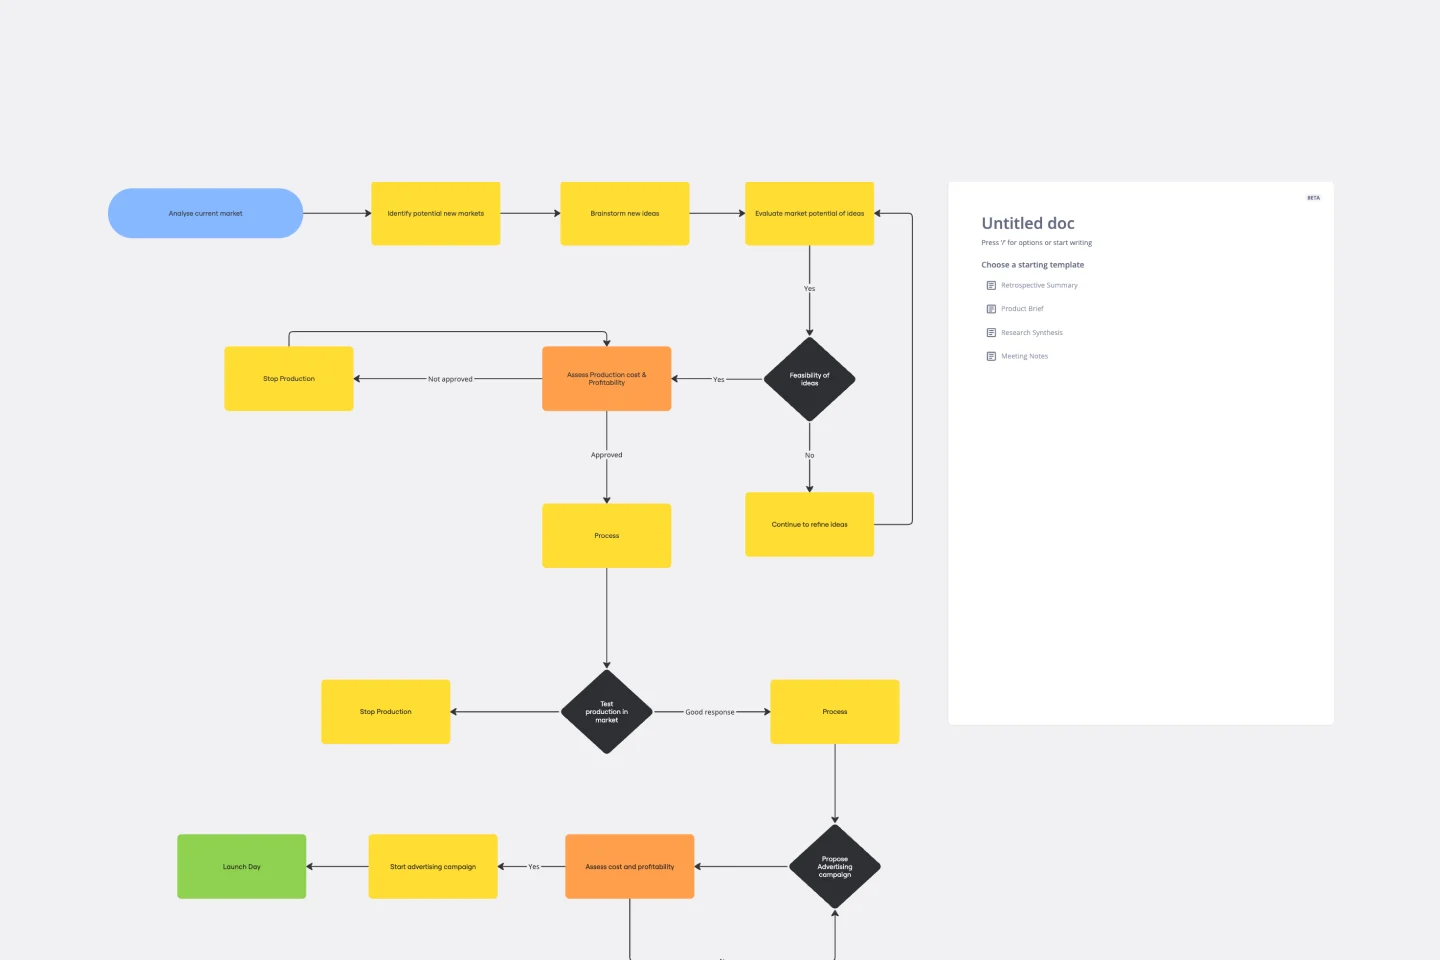
Improve your product development process with the product development flowchart template. The template offers a shared space where team members can provide real time input and feedback as they engage in the various stages of product creation. This collaborative feature ensures that everyone involved is on the same page, reducing the likelihood of miscommunication and enhancing overall project efficiency. By centralizing insights and ideas within the flowchart, teams can collectively shape and refine the product development process, leading to a more cohesive and successful outcome.
Funding Tracker Template
Funding Tracker Template
For many organizations, especially non-profits, funding is their lifeblood—and meeting fundraising goals is a crucial part of carrying out their mission. A funding tracker gives them a powerful, easy-to-use tool for measuring their progress and staying on course. And beyond helping you visualize milestones, this template will give you an effective way to inspire the public to donate, and help you keep track of those donors. It’s especially useful when you have multiple donations coming from a variety of sources.
ERD Customer Relationship Management (CRM) Template
ERD Customer Relationship Management (CRM) Template
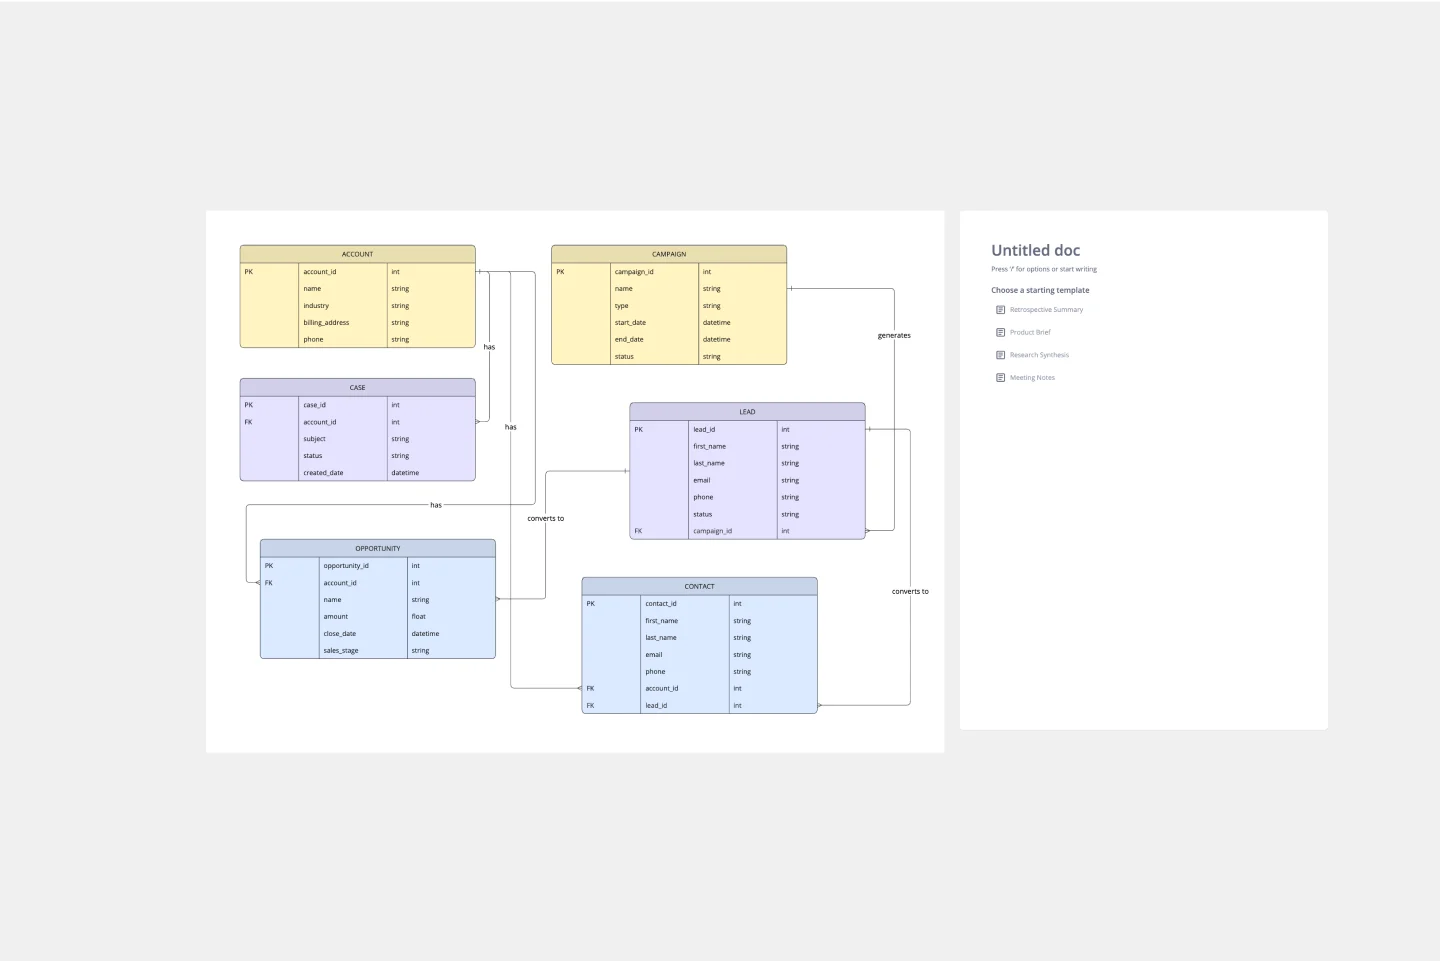
The ERD Customer Relationship Management (CRM) template streamlines and enhances the management of customer relationships within businesses. It focuses on organizing customer information and interactions in a visually intuitive manner. Key entities such as Customer, Interaction, Sales Opportunity, Product, and Support Ticket are central to the template, facilitating the tracking of customer relationships, sales funnel activities, product purchases, and customer service interactions. This structured approach is critical for boosting customer satisfaction and optimizing sales strategies, making the ERD CRM template an invaluable asset for businesses aiming to improve their CRM processes.
2-Circle Venn Diagram Template
2-Circle Venn Diagram Template
The 2 Circle Venn Diagram Template is a dynamic, intuitive tool designed to represent the logical relationships between two data sets visually. For teams, this template proves valuable in enabling efficient collaboration, clear communication, and shared understanding.
Product Development Flowchart Template
Product Development Flowchart Template
Improve your product development process with the product development flowchart template. The template offers a shared space where team members can provide real time input and feedback as they engage in the various stages of product creation. This collaborative feature ensures that everyone involved is on the same page, reducing the likelihood of miscommunication and enhancing overall project efficiency. By centralizing insights and ideas within the flowchart, teams can collectively shape and refine the product development process, leading to a more cohesive and successful outcome.
Funding Tracker Template
Funding Tracker Template
For many organizations, especially non-profits, funding is their lifeblood—and meeting fundraising goals is a crucial part of carrying out their mission. A funding tracker gives them a powerful, easy-to-use tool for measuring their progress and staying on course. And beyond helping you visualize milestones, this template will give you an effective way to inspire the public to donate, and help you keep track of those donors. It’s especially useful when you have multiple donations coming from a variety of sources.
ERD Customer Relationship Management (CRM) Template
ERD Customer Relationship Management (CRM) Template
The ERD Customer Relationship Management (CRM) template streamlines and enhances the management of customer relationships within businesses. It focuses on organizing customer information and interactions in a visually intuitive manner. Key entities such as Customer, Interaction, Sales Opportunity, Product, and Support Ticket are central to the template, facilitating the tracking of customer relationships, sales funnel activities, product purchases, and customer service interactions. This structured approach is critical for boosting customer satisfaction and optimizing sales strategies, making the ERD CRM template an invaluable asset for businesses aiming to improve their CRM processes.