About the Force Field Analysis Template
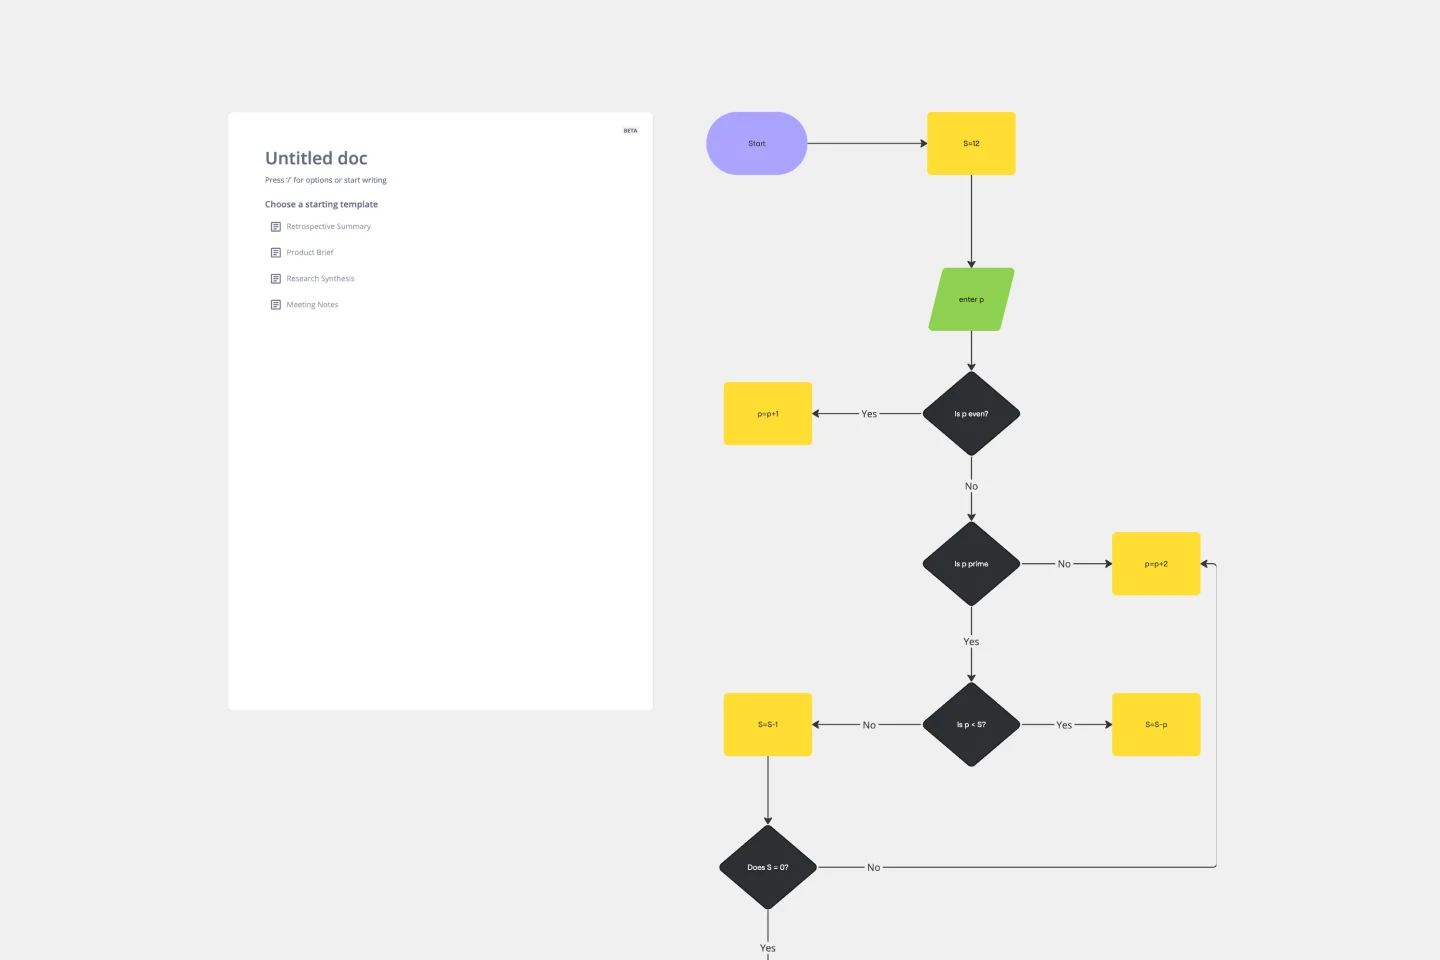
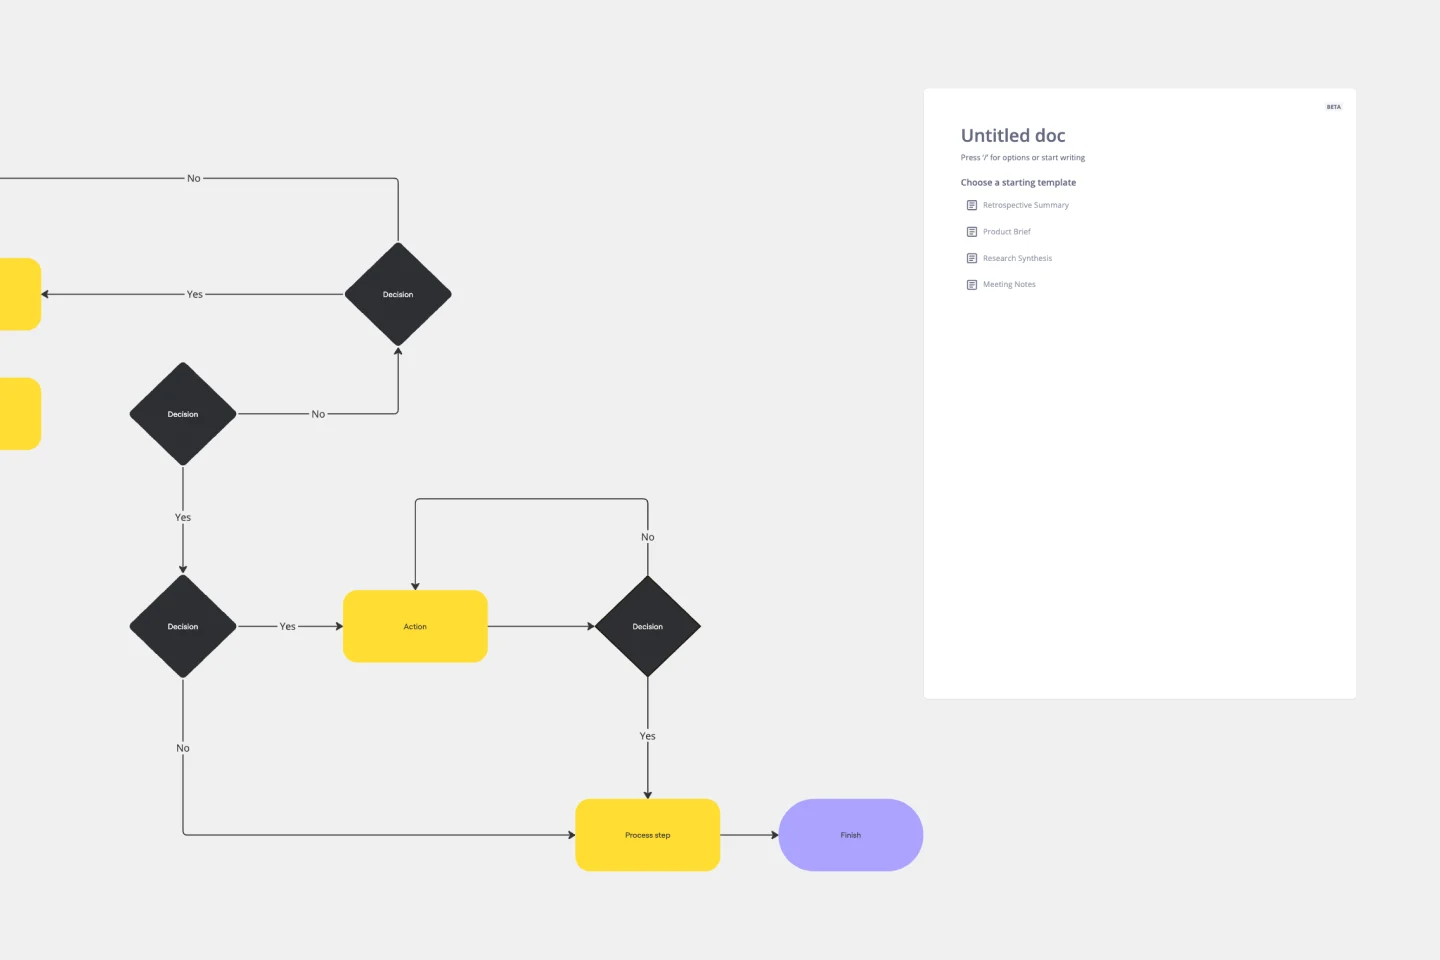
Force Field Analysis is a powerful tool that can help you identify and analyze the various factors that can impact the success of a project or initiative. The force field analysis template is a great way to get started with this technique, allowing you to quickly visualize and organize your thoughts in a collaborative and dynamic way.
What is the force field analysis template?
The force field analysis template is a simple yet effective way to understand and analyze the forces that can influence the success of your project. It consists of two main areas - driving forces and restraining forces - which can be broken down into more specific factors.
For example, driving forces might include factors such as increased revenue, improved customer satisfaction, or enhanced productivity, while restraining forces might include factors such as increased competition, budget constraints, or lack of resources.
How to use the force field analysis template in Miro
Here are the steps to use the Force Field Analysis template in Miro:
Open the template in your Miro board.
Start editing the template by adding or removing shapes and connector lines.
Use automated diagramming features to expand the template as needed.
Add any artifact on a Miro board to provide more context to your analysis.
Why should you use a force field analysis template?
There are many benefits to making a force field analysis, including:
Increased clarity: The template can help you identify the key factors that are driving or restraining your project, allowing you to focus on the most important areas.
Improved decision-making: By analyzing the various factors that impact your project, you can make more informed decisions about how to move forward.
Enhanced collaboration: The template allows you to work collaboratively with your team, fostering communication and collaboration.
Increased creativity: The force field analysis template helps you think outside the box and come up with innovative solutions to complex problems.
Better alignment: By identifying the key driving and restraining forces, you can ensure that your team is aligned around a common goal.
Do you need more advanced diagramming? Miro's extensive shape pack library, collaboration features, and technical diagramming capabilities provide robust solutions for teams.
Force Field Analysis Template FAQs
Can I customize the template to fit my specific needs?
Absolutely! The template is fully customizable, allowing you to add or remove shapes and connector lines as needed.
How can I collaborate with my team on the template?
Miro allows for real-time collaboration, so you can work together with your team in real-time, no matter where you are.
Can I export the template to other platforms?
Yes, Miro allows you to export your templates to various formats, including PDF, PNG, and JPEG.

Miro
Your virtual workspace for innovation
Miro is an innovation workspace designed for teams of every size, everywhere, to dream, design, and build the future together. Our mission? To empower these teams to create the next big thing, powered by AI at every step of the way. Over 90 million users around the world rely on Miro to untangle complex ideas, put customer needs first, and deliver products and services faster. All supported by best-in-class security, compliance, and scalability.
Categories
Similar templates
Yes No Flowchart Template

Yes No Flowchart Template
The Yes-No Flowchart Template is a simple and efficient tool that helps to simplify complex decision-making processes into clear and easy-to-follow steps. This template uses standard shapes to illustrate processes, decisions, and outcomes, with arrows that guide users from one action point to the next based on binary 'yes' or 'no' decisions. Its most prominent benefit is its ability to bring clarity to decision-making. By presenting processes visually, teams can effortlessly understand and navigate complex scenarios, ensuring that each step is transparent and reducing the potential for misunderstandings or missteps.
Cross Functional Flowchart

Cross Functional Flowchart
Have a quick look at everyone on a project and see exactly what they’ll contribute. That’s the clarity and transparency a cross-functional flowchart will give you. These are also called “swim lane” flowcharts because each person (each customer, client, or representative from a specific function) is assigned a lane—a clear line—that will help you visualize their roles at each stage of the project. This template will empower you to streamline processes, reduce inefficiencies, and make meaningful cross-functional relationships.
Website Flowchart Template

Website Flowchart Template
A website flowchart, also known as a sitemap, maps out the structure and complexity of any current or future website. The flowchart can also help your team identify knowledge gaps for future content. When you’re building a website, you want to ensure that each piece of content gives users accurate research results based on keywords associated with your web content. Product, UX, and content teams can use flowcharts or sitemaps to understand everything contained in a website, and plan to add or restructure content to improve a website’s user experience.
Algorithm Flowchart Template

Algorithm Flowchart Template
The Algorithm Flowchart Template is a useful tool for simplifying the process of creating and understanding complex algorithms. Its pre-structured format makes it easy to lay out each operation and decision point in a clear and easily understandable visual format. This is particularly helpful for explaining intricate processes to team members who may not be as technically proficient in the subject matter. With each step clearly defined within its designated shape, the flowchart promotes clarity and makes it easy to identify the logical flow at a glance. This clarity is the template's most significant advantage, reducing cognitive load and enabling a more inclusive and straightforward approach to discussing and refining algorithmic solutions.
Production Flowchart Template

Production Flowchart Template
The Production Flowchart Template is a well-crafted tool that clearly represents a production process from start to finish. It breaks down complex procedures into easy-to-understand segments, making it easier for stakeholders to grasp the entire process. One of the key benefits of using this template is that it helps to clarify complex production pathways. By mapping out operations visually, teams can identify potential bottlenecks or inefficiencies, facilitating timely and well-informed decision-making.
Yes No Flowchart Template

Yes No Flowchart Template
The Yes-No Flowchart Template is a simple and efficient tool that helps to simplify complex decision-making processes into clear and easy-to-follow steps. This template uses standard shapes to illustrate processes, decisions, and outcomes, with arrows that guide users from one action point to the next based on binary 'yes' or 'no' decisions. Its most prominent benefit is its ability to bring clarity to decision-making. By presenting processes visually, teams can effortlessly understand and navigate complex scenarios, ensuring that each step is transparent and reducing the potential for misunderstandings or missteps.
Cross Functional Flowchart

Cross Functional Flowchart
Have a quick look at everyone on a project and see exactly what they’ll contribute. That’s the clarity and transparency a cross-functional flowchart will give you. These are also called “swim lane” flowcharts because each person (each customer, client, or representative from a specific function) is assigned a lane—a clear line—that will help you visualize their roles at each stage of the project. This template will empower you to streamline processes, reduce inefficiencies, and make meaningful cross-functional relationships.
Website Flowchart Template

Website Flowchart Template
A website flowchart, also known as a sitemap, maps out the structure and complexity of any current or future website. The flowchart can also help your team identify knowledge gaps for future content. When you’re building a website, you want to ensure that each piece of content gives users accurate research results based on keywords associated with your web content. Product, UX, and content teams can use flowcharts or sitemaps to understand everything contained in a website, and plan to add or restructure content to improve a website’s user experience.
Algorithm Flowchart Template

Algorithm Flowchart Template
The Algorithm Flowchart Template is a useful tool for simplifying the process of creating and understanding complex algorithms. Its pre-structured format makes it easy to lay out each operation and decision point in a clear and easily understandable visual format. This is particularly helpful for explaining intricate processes to team members who may not be as technically proficient in the subject matter. With each step clearly defined within its designated shape, the flowchart promotes clarity and makes it easy to identify the logical flow at a glance. This clarity is the template's most significant advantage, reducing cognitive load and enabling a more inclusive and straightforward approach to discussing and refining algorithmic solutions.
Production Flowchart Template

Production Flowchart Template
The Production Flowchart Template is a well-crafted tool that clearly represents a production process from start to finish. It breaks down complex procedures into easy-to-understand segments, making it easier for stakeholders to grasp the entire process. One of the key benefits of using this template is that it helps to clarify complex production pathways. By mapping out operations visually, teams can identify potential bottlenecks or inefficiencies, facilitating timely and well-informed decision-making.