
Categories
Similar templates
Product Design Principles Workshop
62 likes
407 uses

User Empathy Map
271 likes
1.3K uses

Research Insights Mapping
173 likes
665 uses

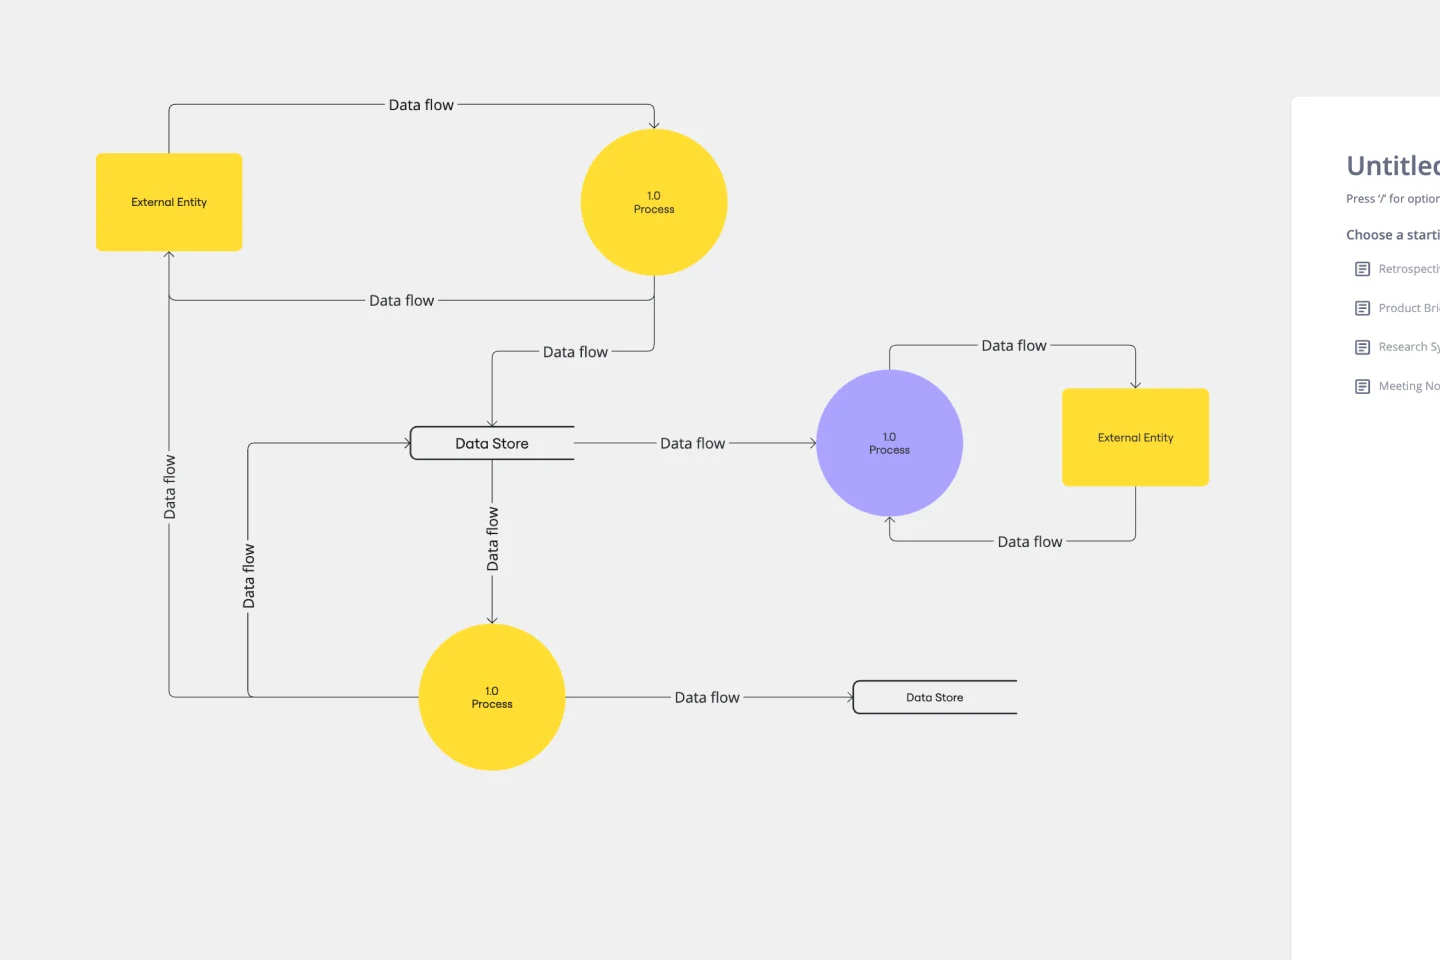
Data Flow Diagram Template
3 likes
374 uses
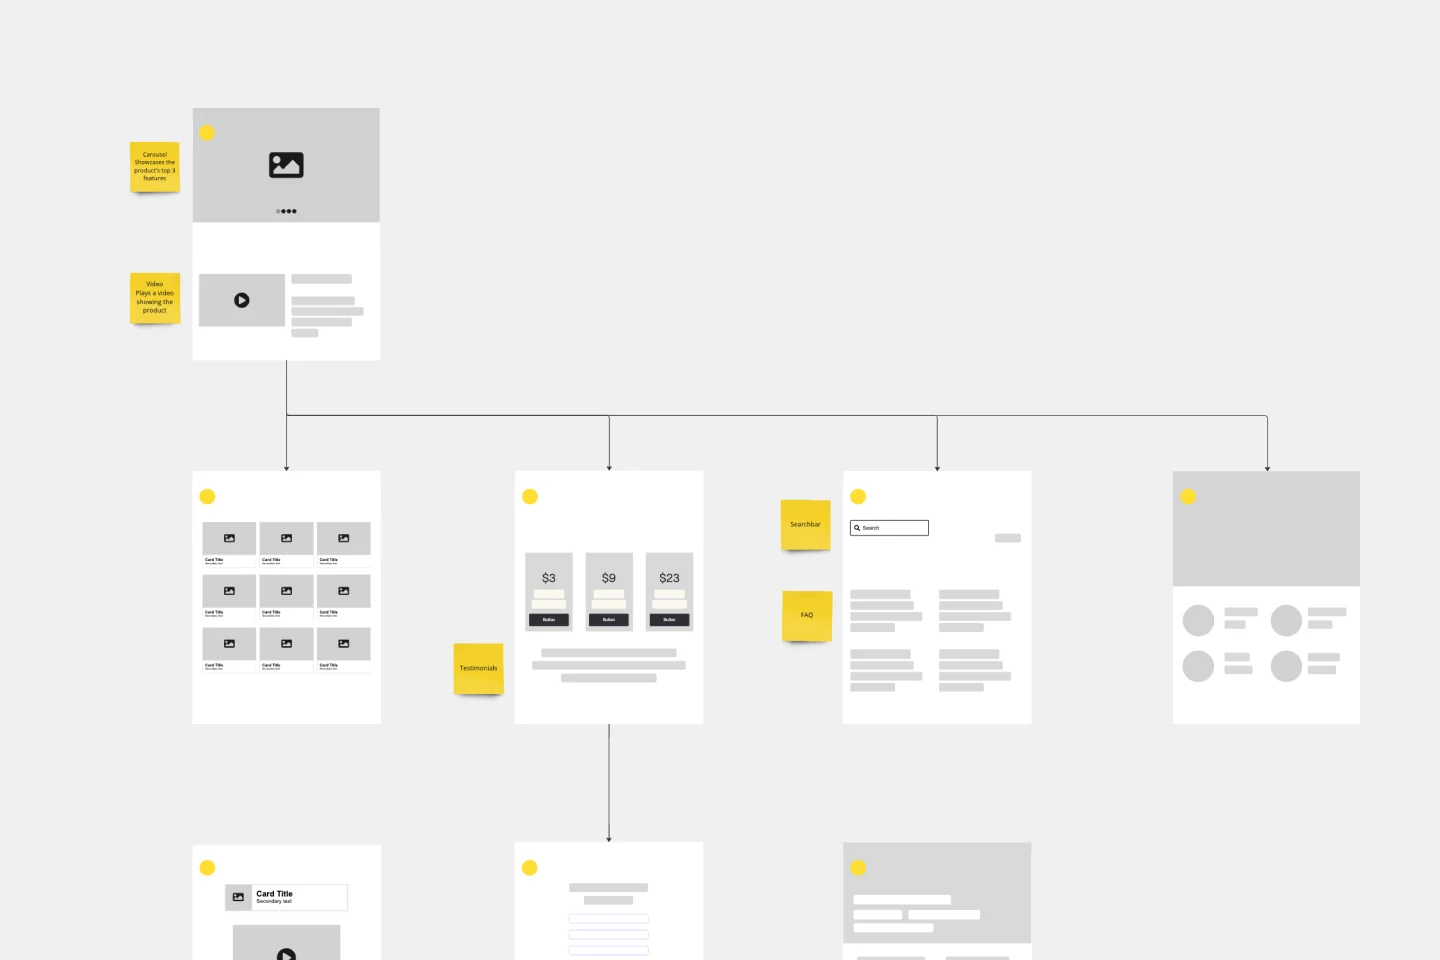
Website Flowchart Template
1 likes
286 uses
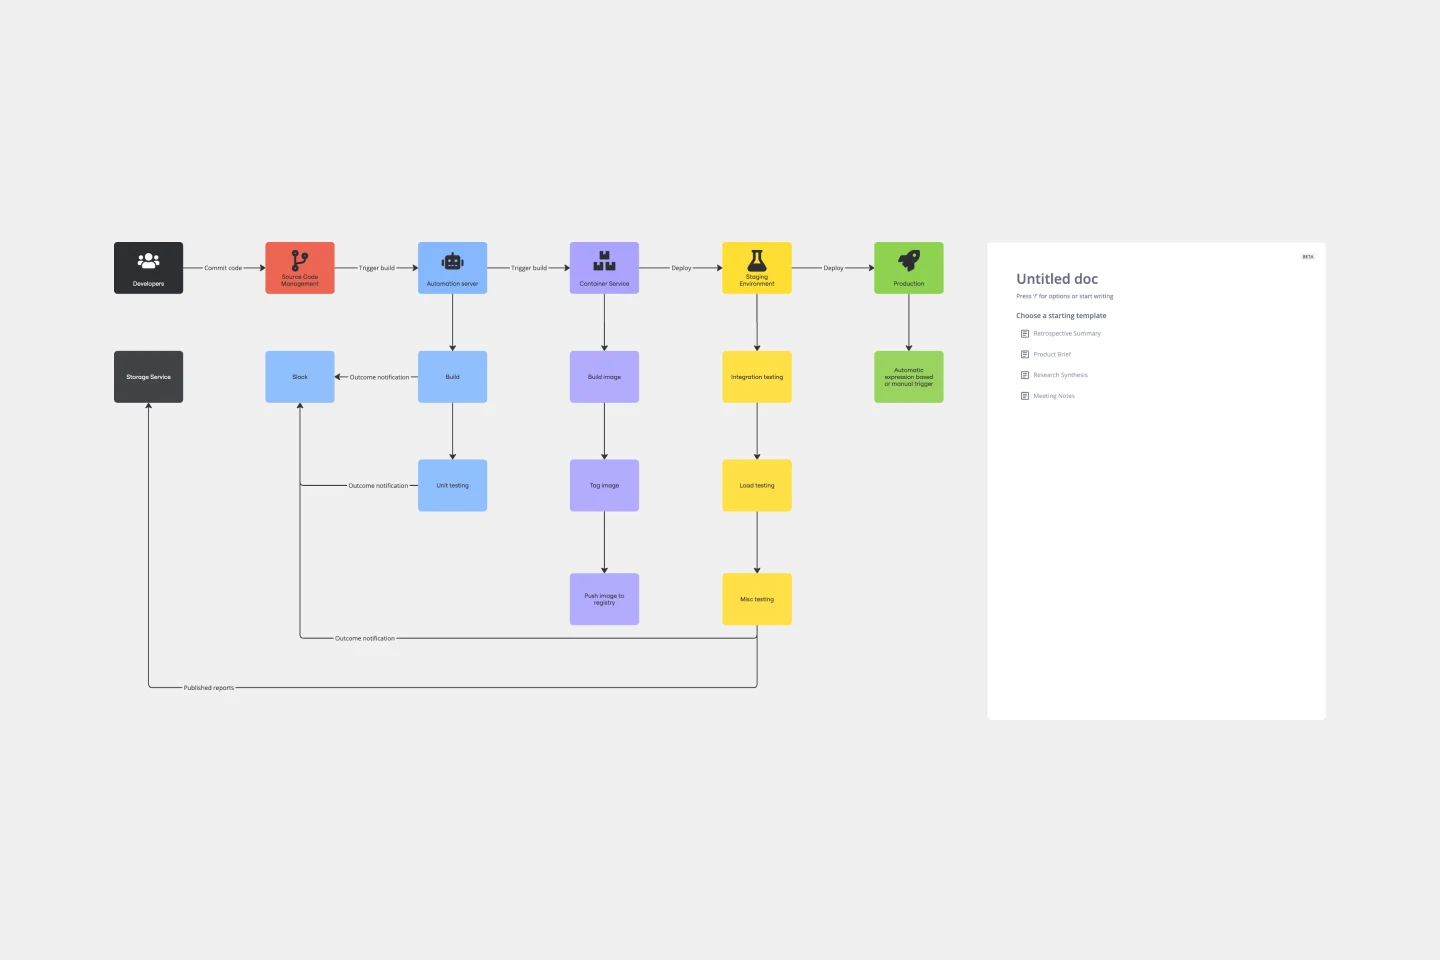
CI/CD Pipeline Diagram Template
1 likes
87 uses
Product Design Principles Workshop
62 likes
407 uses
User Empathy Map
271 likes
1.3K uses
Research Insights Mapping
173 likes
665 uses
Data Flow Diagram Template
3 likes
374 uses
Website Flowchart Template
1 likes
286 uses
CI/CD Pipeline Diagram Template
1 likes
87 uses