Before you can effectively, repeatedly, and reliably deliver value to your customers through a viable business model, you need to understand the ecosystem you’ll be operating within.
An ecosystem map visually represents a process, flow, or system that highlights relationships in a particular context. This ecosystem map gets you thinking of your key players, the segments, and the relationship flow of value.
This template is great for small groups or startups.
How to use this template:
1. As a team, write down your company/ startup in the circle provided.
2. Then, identify who your key players are and drag them around the circle.
3. Then, identify the sub-categories and drag them to each key player they relate to.
4. Begin to connect the key players and value flow by using the lines provided below.
Take a step back, have a look at your ecosystem map, and keep adding on the go!
Ecosystem Mapping Template FAQs
What is ecosystem mapping in UX?
Even though ecosystem maps are helpful to every professional, UX designers benefit significantly from this tool because it helps them understand customer relationships. Ecosystem mapping in UX means that people can see dependencies inside the organization and the blockers to create a more customer-centric approach to business and design. With these answers, UX designers can optimize services and deliver much better user experiences.
How do you create an ecosystem map?
To create an ecosystem map, follow these steps: brainstorm who are the actors of your map (internal players, external players, and customers). Categorize and create clusters. Then, use those categories to illustrate your customer flows, hierarchies, and dependencies. With everything mapped out, you’ll be able to identify opportunities, and what can be improved so you develop and implement a better customer experience.

Categories
Similar templates
PBB Product Backlog Building

Pyramid Diagram Template
Pyramid Diagram Template
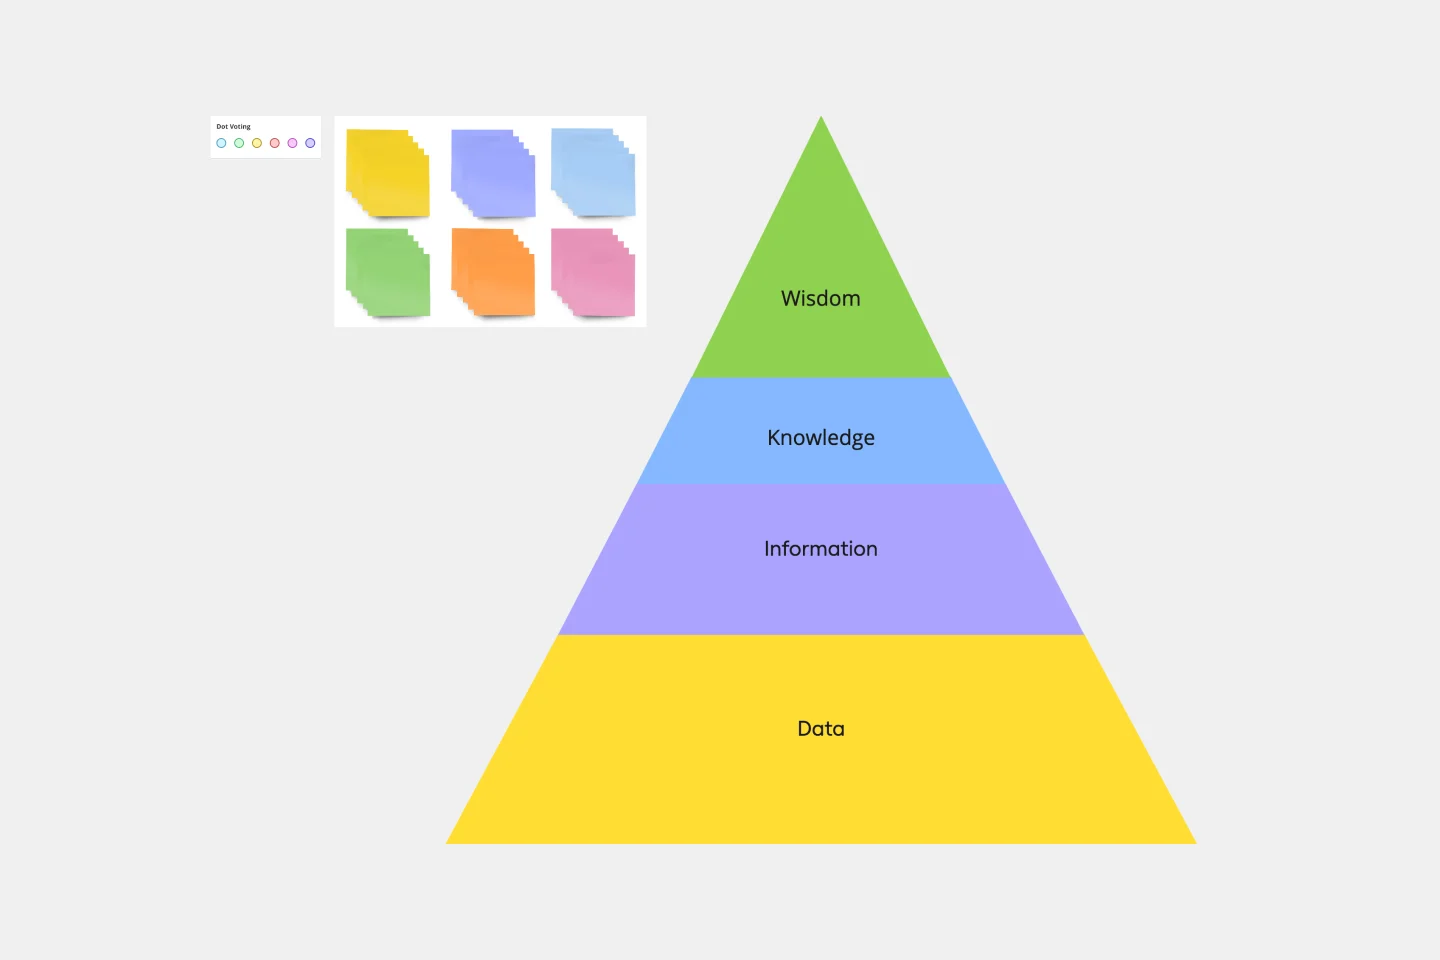
A pyramid diagram is a perfect tool for demonstrating concepts that can be broken down into a layered hierarchy. Each level of the pyramid builds on the one before it, clearly illustrating how certain actions lead to specific results. The Miro Pyramid Diagram template is your tool for any and all pyramid illustrations.
Affinity Diagram Template
Affinity Diagram Template
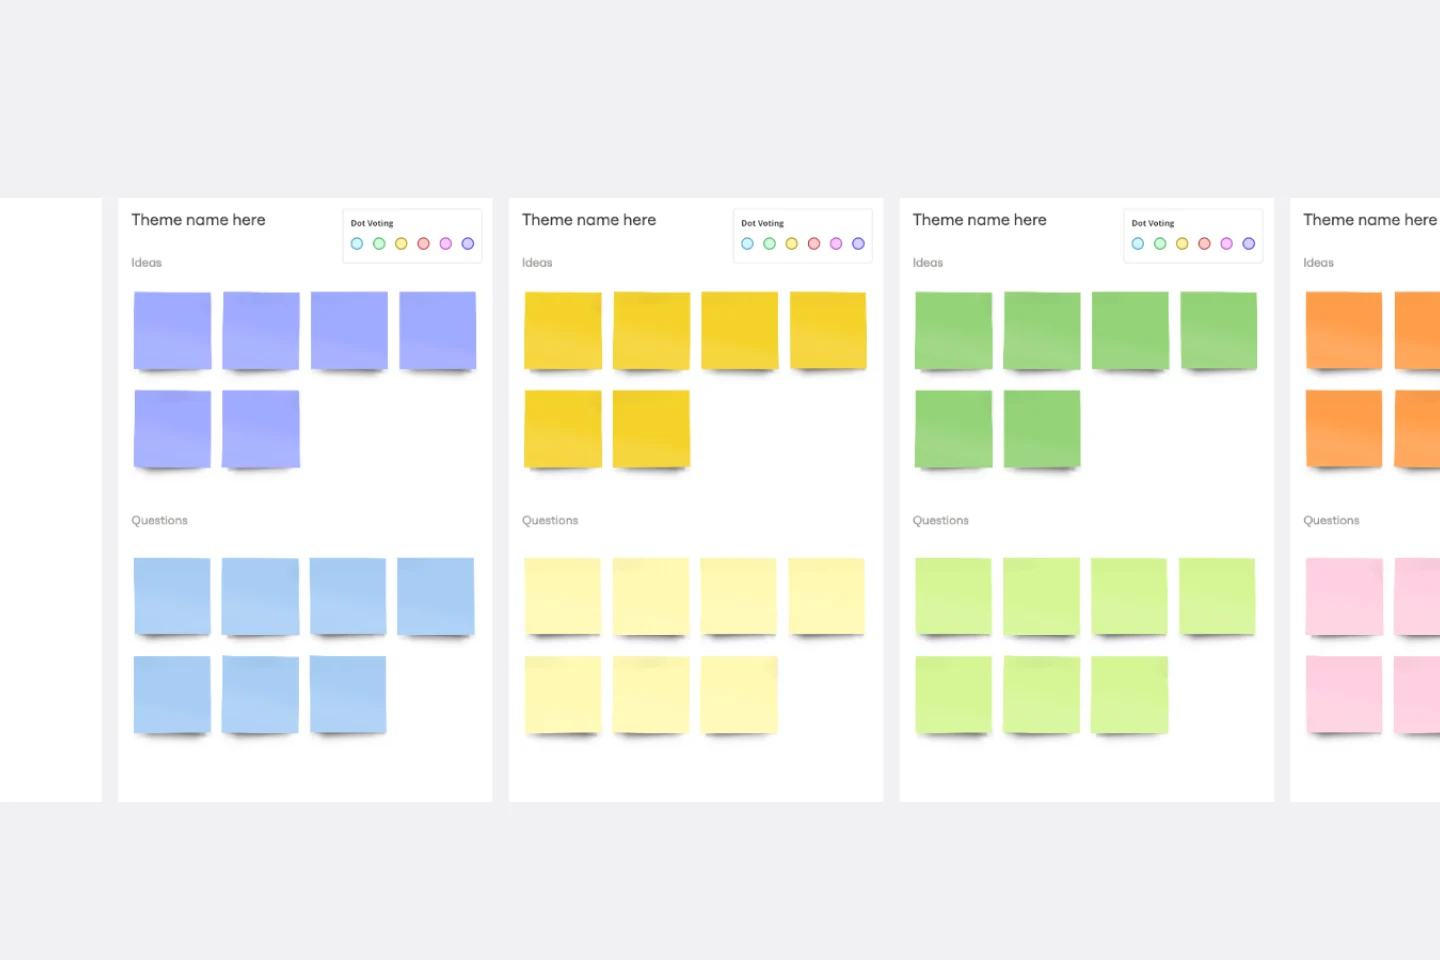
You can use an affinity diagram to generate, organize, and consolidate information that comes out of a brainstorming session. Whether you’re building a product, working through a complex problem, establishing a process, or piecing apart an issue, an affinity diagram is a useful and simple framework that gives each team member the opportunity to pitch in and share their thoughts. But it’s not just ideal for brainstorms—this is a great template and tool when you need to reach consensus or analyze data such as survey results.
Spaghetti Diagram Template
Spaghetti Diagram Template
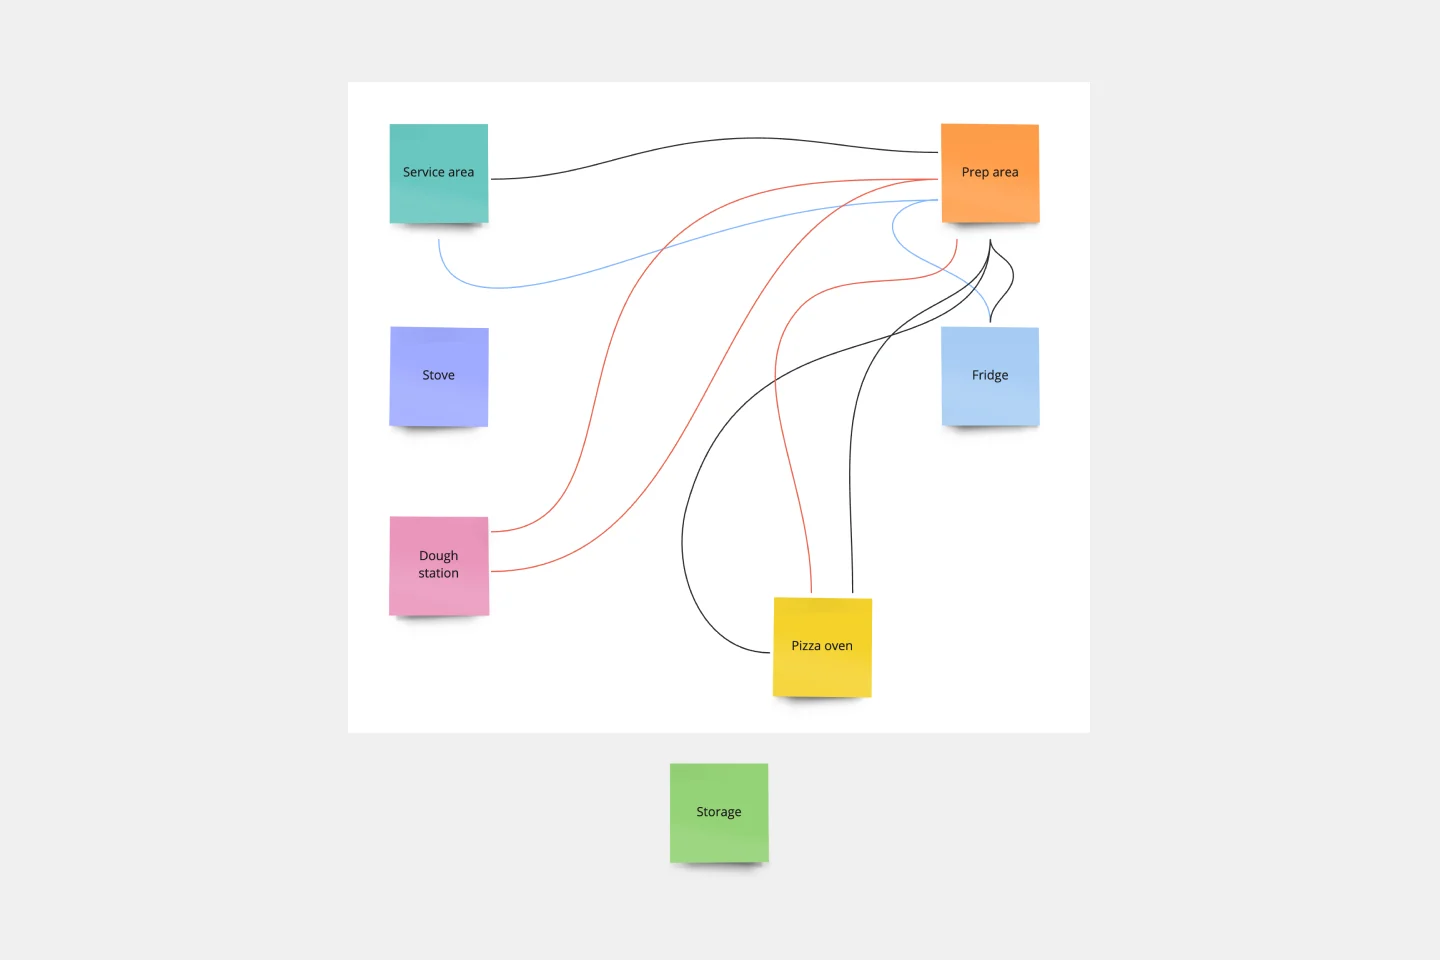
Spaghetti diagrams are valuable for finding connections between assets, services, and products, as well as identifying dependencies in a visual way. Use this template to get an overview of a process and quickly find areas of improvement.
Genogram Template
Genogram Template
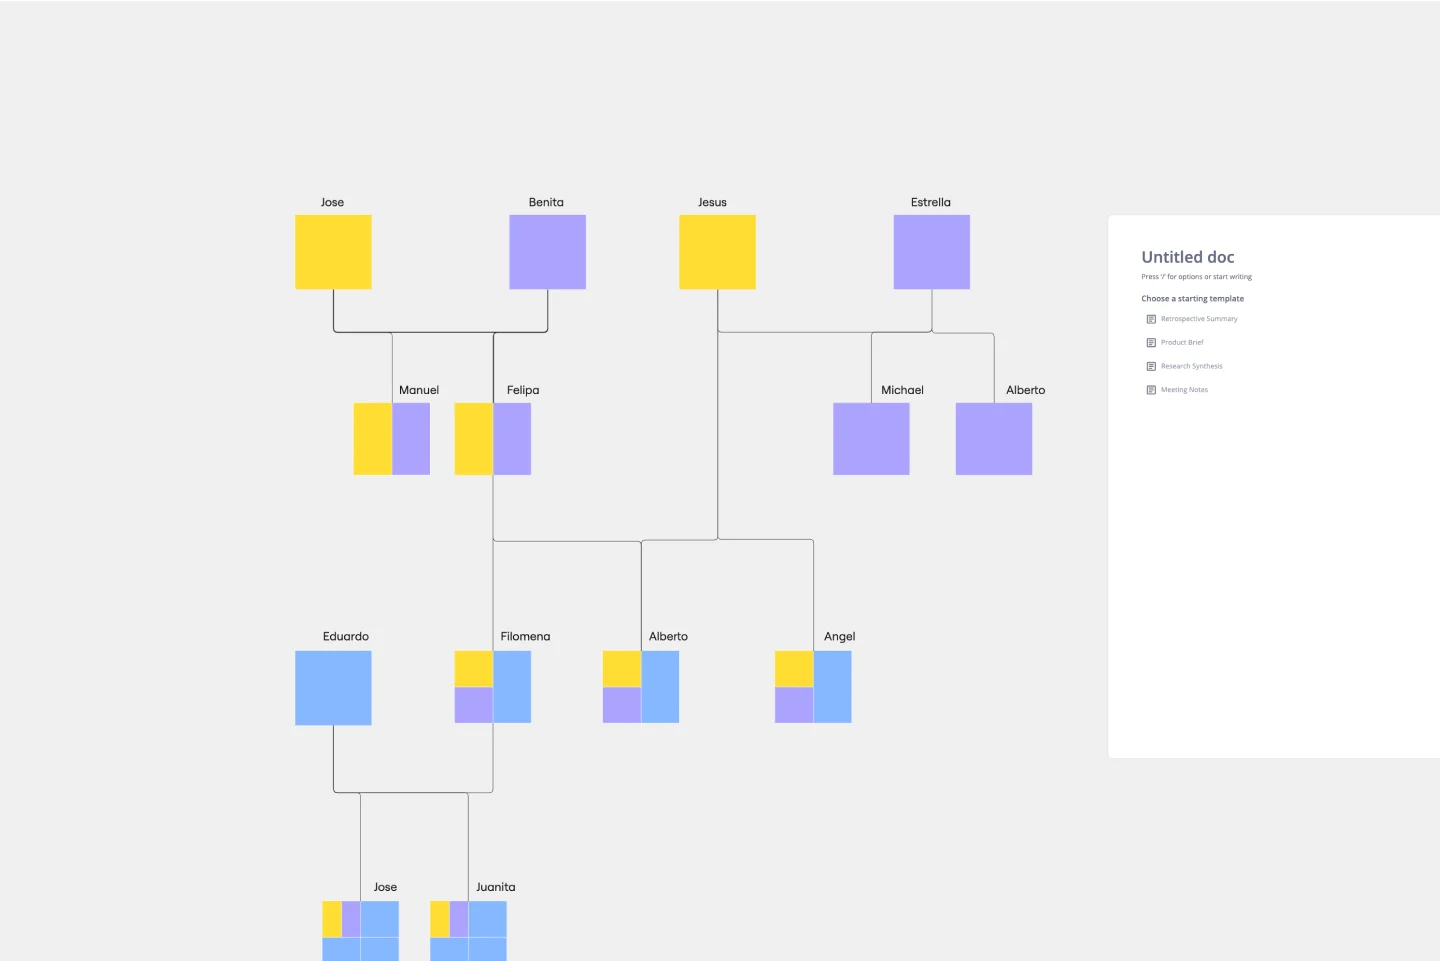
The Genogram Template maps out family structures and relationships with exceptional depth and detail. Unlike traditional family trees, this template provides a comprehensive perspective by encapsulating familial connections, emotional ties, and significant life events. Create a genogram to unearth patterns and trends within a family, whether hereditary or environmental. Professionals across different domains can gain a holistic understanding of familial dynamics by showing deep insights into the nuances of relationships, facilitating better communication and problem-solving.
SDLC Template
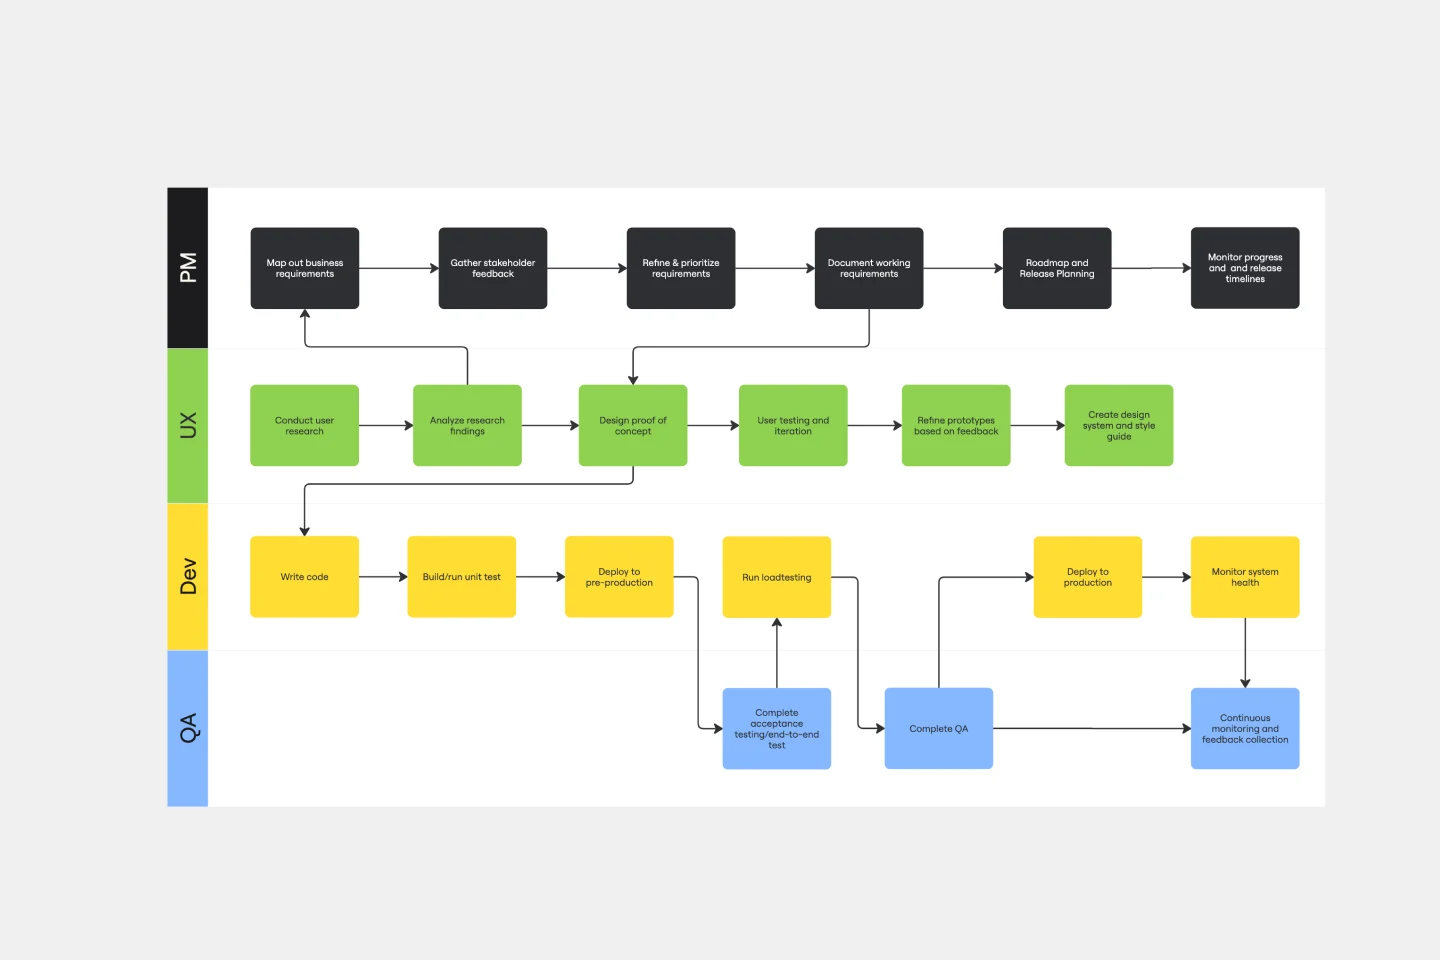
SDLC Template
The Software Development Life Cycle (SDLC) template is a well-designed visual tool that helps software development teams follow a structured approach from the initial concept to the final deployment of the software. One of the most significant benefits of using this template is that it promotes clear, streamlined communication among team members. By breaking the development cycle into distinct phases, all stakeholders can stay informed about the progress of the project and understand their responsibilities within the larger context. This enhanced communication reduces the chances of misunderstandings and ensures that everyone works together towards the common goal of delivering high-quality software. The template acts not only as a roadmap but also as a shared language for the team, improving collaboration and the efficient progression of the project through each critical stage.
PBB Product Backlog Building
Pyramid Diagram Template
Pyramid Diagram Template
A pyramid diagram is a perfect tool for demonstrating concepts that can be broken down into a layered hierarchy. Each level of the pyramid builds on the one before it, clearly illustrating how certain actions lead to specific results. The Miro Pyramid Diagram template is your tool for any and all pyramid illustrations.
Affinity Diagram Template
Affinity Diagram Template
You can use an affinity diagram to generate, organize, and consolidate information that comes out of a brainstorming session. Whether you’re building a product, working through a complex problem, establishing a process, or piecing apart an issue, an affinity diagram is a useful and simple framework that gives each team member the opportunity to pitch in and share their thoughts. But it’s not just ideal for brainstorms—this is a great template and tool when you need to reach consensus or analyze data such as survey results.
Spaghetti Diagram Template
Spaghetti Diagram Template
Spaghetti diagrams are valuable for finding connections between assets, services, and products, as well as identifying dependencies in a visual way. Use this template to get an overview of a process and quickly find areas of improvement.
Genogram Template
Genogram Template
The Genogram Template maps out family structures and relationships with exceptional depth and detail. Unlike traditional family trees, this template provides a comprehensive perspective by encapsulating familial connections, emotional ties, and significant life events. Create a genogram to unearth patterns and trends within a family, whether hereditary or environmental. Professionals across different domains can gain a holistic understanding of familial dynamics by showing deep insights into the nuances of relationships, facilitating better communication and problem-solving.
SDLC Template
SDLC Template
The Software Development Life Cycle (SDLC) template is a well-designed visual tool that helps software development teams follow a structured approach from the initial concept to the final deployment of the software. One of the most significant benefits of using this template is that it promotes clear, streamlined communication among team members. By breaking the development cycle into distinct phases, all stakeholders can stay informed about the progress of the project and understand their responsibilities within the larger context. This enhanced communication reduces the chances of misunderstandings and ensures that everyone works together towards the common goal of delivering high-quality software. The template acts not only as a roadmap but also as a shared language for the team, improving collaboration and the efficient progression of the project through each critical stage.