About the Competitive Analysis Template
The competitive analysis template is where you will analyze and evaluate the competitive landscape for products, services, and companies.
With a simple competitive analysis template, you will be able to answer these questions:
Who are the other companies you’re competing with?
How does your product or service compare?
What makes you stand out?
What are your competitors doing well that you can learn from?
The benefits of the competitive analysis template
When you use a competitive landscape template, you will gain knowledge that can inform your product, marketing, sales strategies, and potentially your business strategy for the future.
By conducting a competitor analysis, you can learn about the market, what’s working and not working for your customers or potential customers, and where there are areas of opportunity for your company.
When you use Miro’s competitive analysis template, you will be able to see everything in one shared space, where you can easily make notes, add stickies, and invite your team to collaborate in real-time or asynchronously.
How to use the competitive analysis template
There are many different competitive analysis examples, and you may want to perform one for each use case. For instance, you can do one for your digital marketing strategy, one for your website, and one for in-person events, to name just a few.
You may want to make adjustments to the competitive analysis template depending on the specific use case, but here are a few common elements you will have in all of them:
Step 1: Start by filling out your company information.
You may wish to include some high-level information about your company, such as your mission, values, value proposition, etc., as well as an overview of your main competitors.
The competitors you list here will often be your direct competitors who offer a comparable product or service.
Step 2: Describe your product/service information.
This can include various price points of your main offerings and your channels to acquire new customers. If you know this information about your competitors, you can list it here, too.
Step 3: Gather information about the market.
This may include your percentage of market share (and the respective percentages of the competitors you’ve listed), your competitors’ social media and web presence, and how your company is positioned in the market.
Step 4: Perform a SWOT analysis.
Determine your strengths, weaknesses, opportunities, and threats in comparison with the competitors you’ve identified.
Step 5: Define your competitive advantage.
With all the information you’ve gathered in the previous steps, you can now define your competitive advantage.
What areas separate you from the competition, and how can you continue to make the most of them?
Discover more competitive analysis examples that you can use now.
Competitive Analysis Template FAQs
Can I customize the template to include additional competitors or specific criteria?
The template can be tailored to your specific needs by allowing you to add more competitors or criteria relevant to your industry or market. This customization feature enables you to create a highly valuable competitor analysis report that is relevant to your business needs.
How frequently should I update the competitive analysis using this template?
To stay competitive in your industry, it is crucial to continuously monitor your competition. The competitive analysis process should be ongoing, and your template should be updated regularly to ensure you have the most accurate and up-to-date information. At a minimum, you should aim to update the competitive landscape template once a year, but it's important to also update it when there are any significant changes in your industry or market. By doing so, you can identify emerging trends or threats and make informed decisions to stay ahead of the competition.
Is there a recommended format for presenting the information within the template?
There is no specific format for presenting the information within the template. However, presenting the information clearly and concisely is always good practice, using headings and subheadings wherever necessary. Consider using bullet points or numbered lists to make the information more readable. Ultimately, the format you choose will depend on the type of information you're presenting and the intended audience.

Miro
Your virtual workspace for innovation
Miro is an innovation workspace designed for teams of every size, everywhere, to dream, design, and build the future together. Our mission? To empower these teams to create the next big thing, powered by AI at every step of the way. Over 90 million users around the world rely on Miro to untangle complex ideas, put customer needs first, and deliver products and services faster. All supported by best-in-class security, compliance, and scalability.
Categories
Similar templates
SWOT Analysis Template
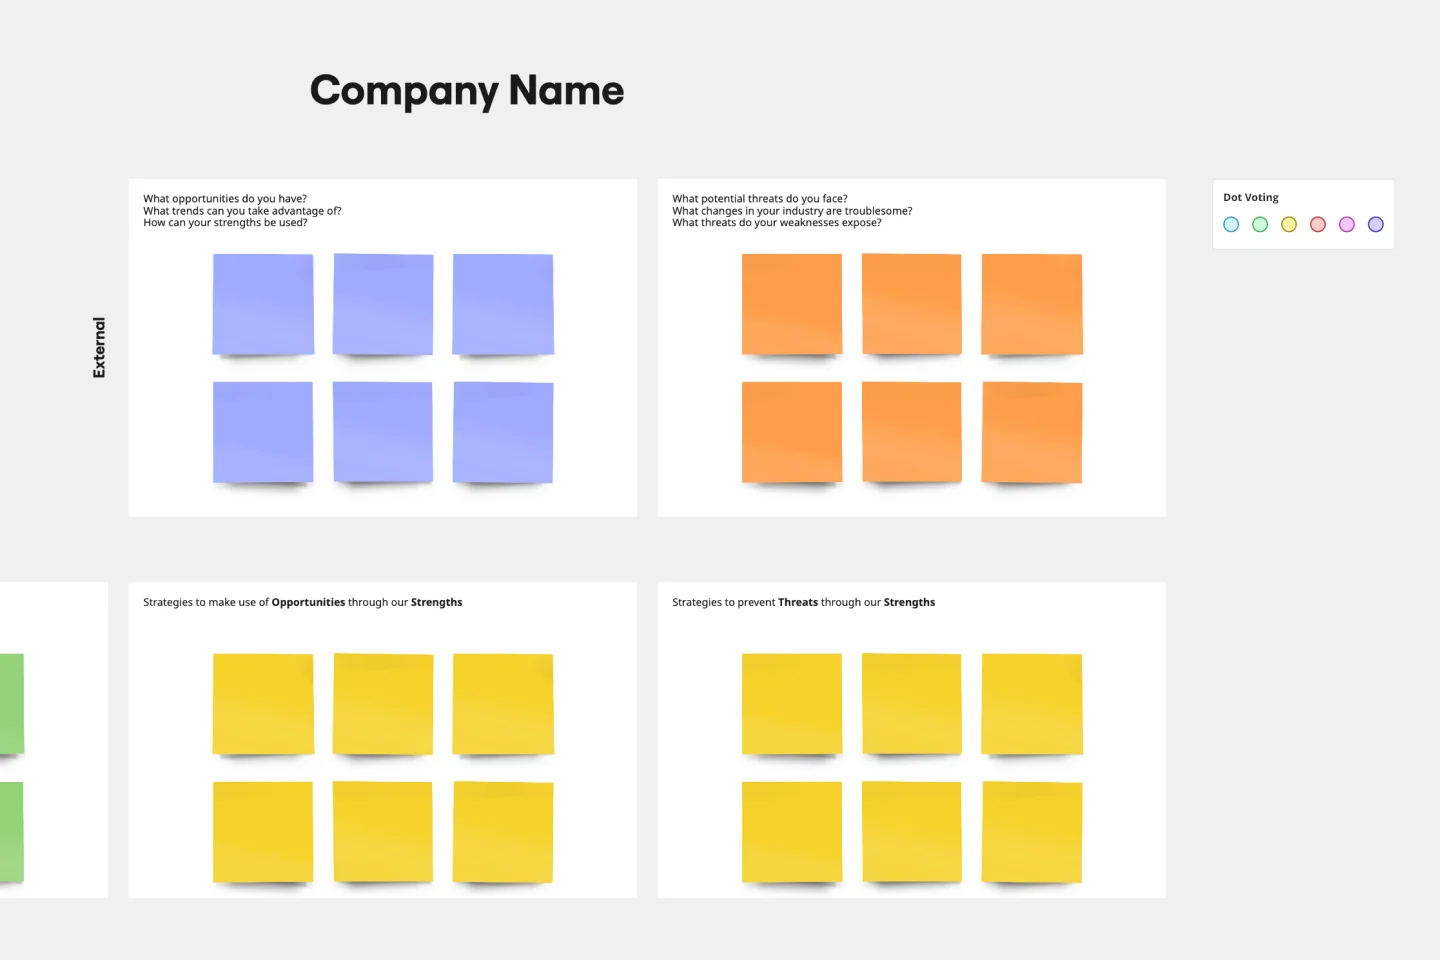
SWOT Analysis Template
When you’re developing a business strategy, it can be hard to figure out what to focus on. A SWOT analysis helps you hone in on key factors. SWOT stands for Strengths, Weaknesses, Opportunities, and Threats. Strengths and weaknesses are internal factors, like your employees, intellectual property, marketing strategy, and location. Opportunities and threats are usually external factors, like market fluctuations, competition, prices of raw materials, and consumer trends. Conduct a SWOT analysis whenever you want to explore opportunities for new businesses and products, decide the best way to launch a product, unlock your company’s potential, or use your strengths to develop opportunities.
PESTLE Analysis Template
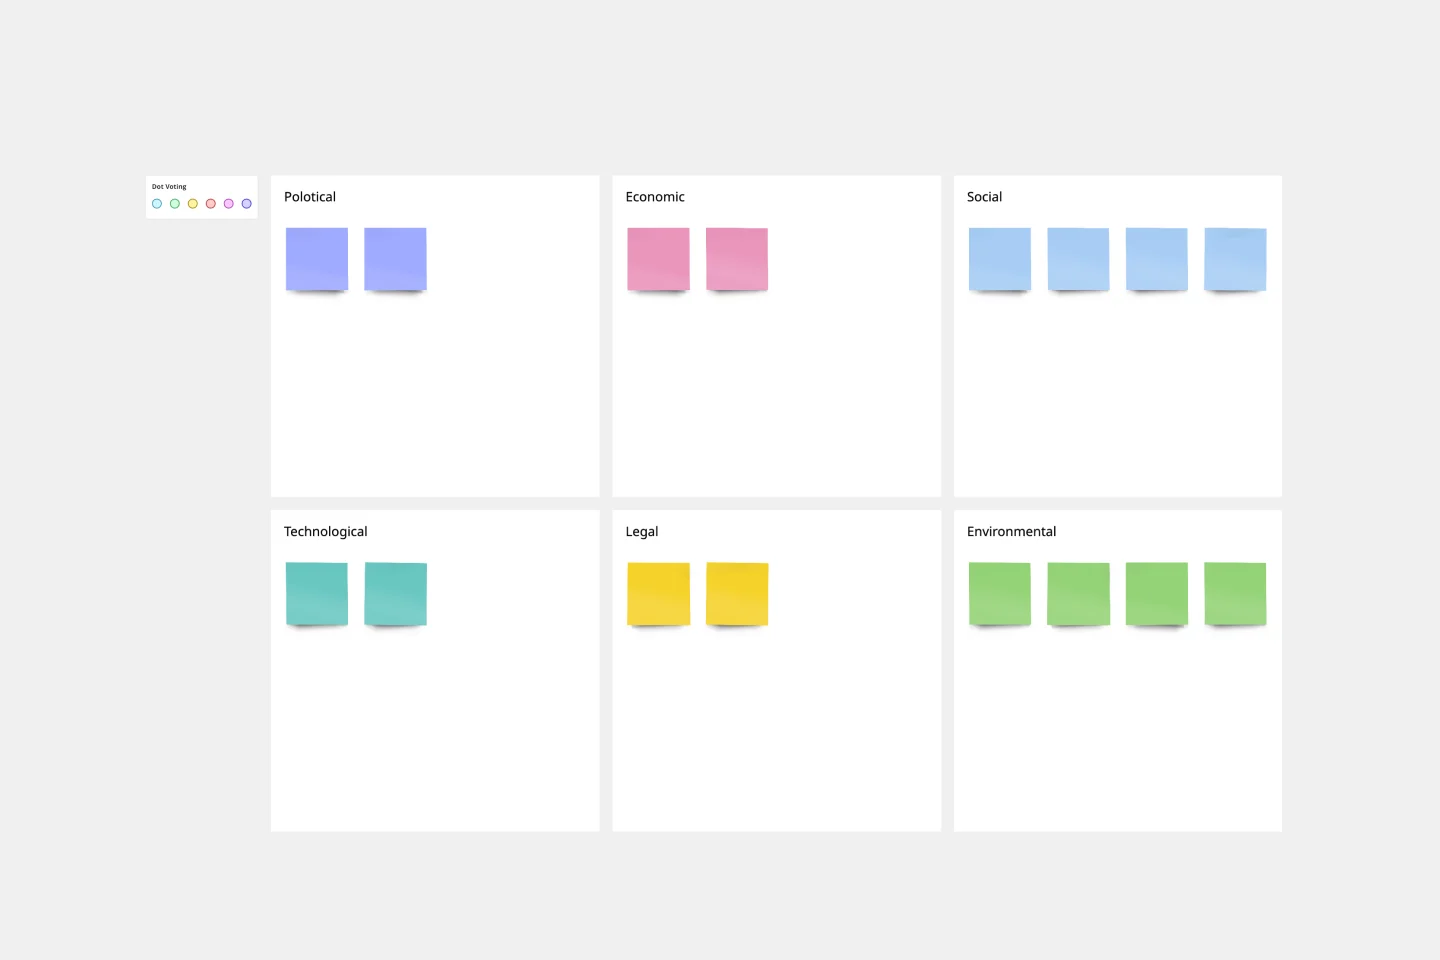
PESTLE Analysis Template
Want to keep your company secure and performing soundly? You have to first know how you’ll be affected by outside elements and factors — especially those that are political, economic, social, technological, legal and environmental in nature. A PESTLE Analysis helps you identify them and prepare for them. With this easy-to-use template, you can conduct a PESTLE Analysis, then use the results to shape your strategic planning, budget allocation, marketing, product updates, and organizational change initiatives.
PEST Analysis Template
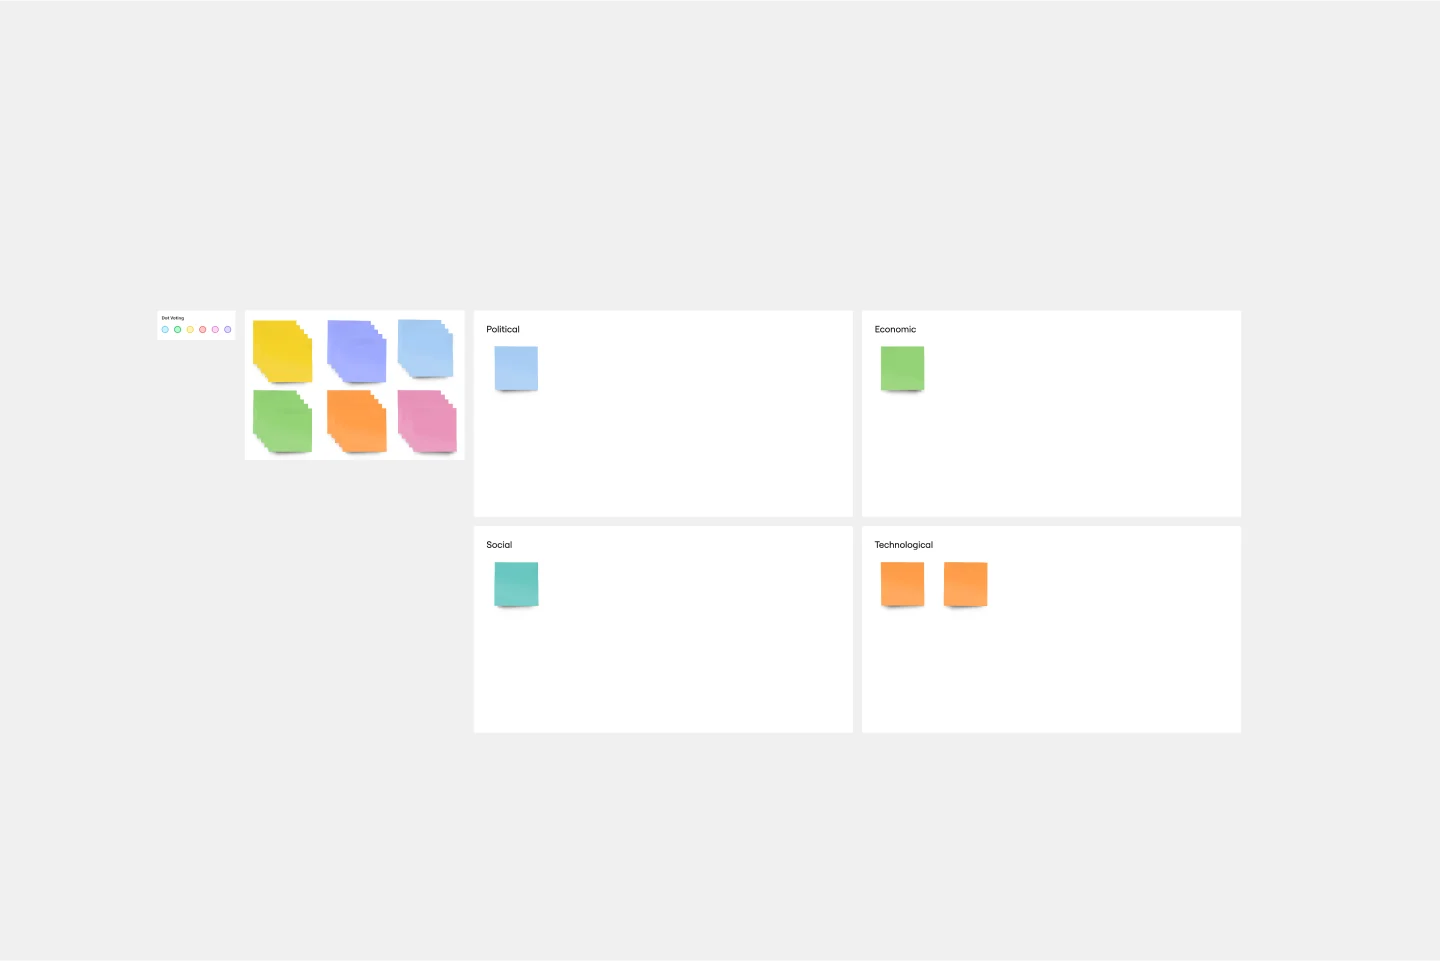
PEST Analysis Template
No business operates inside a vacuum, so if you want to succeed, you have to successfully deal with local laws, government regulating bodies, the health of the local economy, social factors like the unemployment rate, average household income, and more. Use the PEST Analysis Template to help you explore how the world impacts your business and how you can work around it.
SWOT Analysis Template
SWOT Analysis Template
When you’re developing a business strategy, it can be hard to figure out what to focus on. A SWOT analysis helps you hone in on key factors. SWOT stands for Strengths, Weaknesses, Opportunities, and Threats. Strengths and weaknesses are internal factors, like your employees, intellectual property, marketing strategy, and location. Opportunities and threats are usually external factors, like market fluctuations, competition, prices of raw materials, and consumer trends. Conduct a SWOT analysis whenever you want to explore opportunities for new businesses and products, decide the best way to launch a product, unlock your company’s potential, or use your strengths to develop opportunities.
PESTLE Analysis Template
PESTLE Analysis Template
Want to keep your company secure and performing soundly? You have to first know how you’ll be affected by outside elements and factors — especially those that are political, economic, social, technological, legal and environmental in nature. A PESTLE Analysis helps you identify them and prepare for them. With this easy-to-use template, you can conduct a PESTLE Analysis, then use the results to shape your strategic planning, budget allocation, marketing, product updates, and organizational change initiatives.
PEST Analysis Template
PEST Analysis Template
No business operates inside a vacuum, so if you want to succeed, you have to successfully deal with local laws, government regulating bodies, the health of the local economy, social factors like the unemployment rate, average household income, and more. Use the PEST Analysis Template to help you explore how the world impacts your business and how you can work around it.