About the Ansoff Matrix template
When your business is doing well, it can be easy to slip into complacency. But if your organization is to keep growing and scaling, you’ll have to look for new ways to boost your bottom line and reach new customers. The Ansoff Matrix, also known as the product or market expansion grid, can help you do just that.
An Ansoff Matrix is a strategic tool that allows you to evaluate numerous options for growing your business. It helps you evaluate the potential risks of each option and to devise a plan that fits your specific organization. Igor Ansoff developed the matrix in 1957, and since then, numerous business leaders have used it to jumpstart their business’s growth.
While there are some variations, the typical Ansoff Grid contains four quadrants. Each quadrant contains a potential growth strategy. Whenever you move into a new quadrant, either horizontally or vertically, your risk increases.
How do you use the Ansoff Matrix?
The Ansoff Matrix is divided into four sections that place markets and products/services depending on whether they already exist or represent a future opportunity. The four sections are market penetration, market development, product development, and diversification. Market penetration refers to selling more of your products and services to existing customers, market development refers to entering new markets, product development refers to developing your existing products or services, and diversification refers to moving into new markets with new products and services, increasing sales with your existing customer base, and acquisition. Go through each section with your team and determine where there are areas for making changes or improvements.
When should you use the Ansoff Matrix?
You should use the Ansoff Matrix whenever you do strategic planning for your marketing organization. You may find it beneficial to fill out the matrix at least once a year, though potentially more frequently if conditions are changing rapidly in your industry.
What factors go into an Ansoff Matrix?
Factor 1 - Market penetration. The lower left quadrant contains the safest of the four options. Market penetration focuses on boosting sales of your product in your existing market. This is a low-risk option because you already know the market and you’re aware of your product’s strengths and weaknesses relative to your competitors.
Factor 2 - Product development. The lower right quadrant is slightly more risky. In this approach, you’re introducing a new product into your existing market.
Factor 3 - Market development. The upper left quadrant is even riskier. In this case, you’re launching an existing product in a new market. This strategy involves either finding a new use case for your product or adding features so that it meets a different customer need.
Factor 4 - Diversification. The upper right quadrant contains the riskiest option. You’re introducing a new product into a new market.

Miro
Your virtual workspace for innovation
Miro is an innovation workspace designed for teams of every size, everywhere, to dream, design, and build the future together. Our mission? To empower these teams to create the next big thing, powered by AI at every step of the way. Over 90 million users around the world rely on Miro to untangle complex ideas, put customer needs first, and deliver products and services faster. All supported by best-in-class security, compliance, and scalability.
Categories
Similar templates
Eisenhower Matrix Template
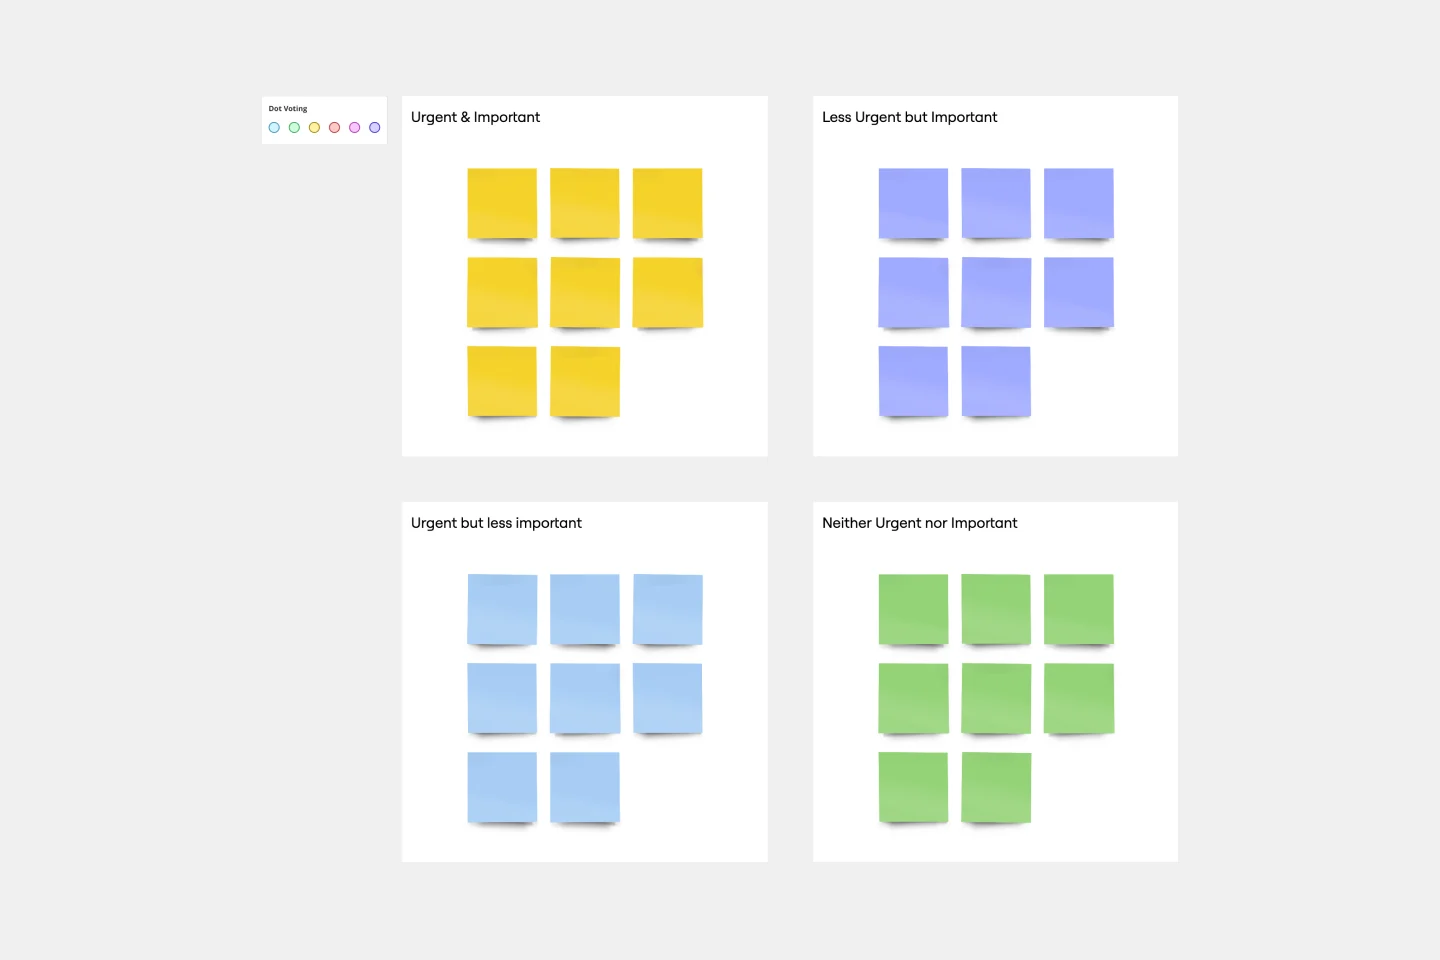
Eisenhower Matrix Template
Have an overwhelming list of to-dos? Prioritize them based on two key factors: urgency and importance. It worked for American president Dwight D. Eisenhower, and it can work for you—this decision-making framework will help you know where to start and how to plan your day. With our template, you can easily build an Eisenhower Matrix with a quadrant of key areas (Do, Schedule, Delegate, and Don’t Do) and revisit it throughout the day as your priorities change.
Innovation Matrix Template
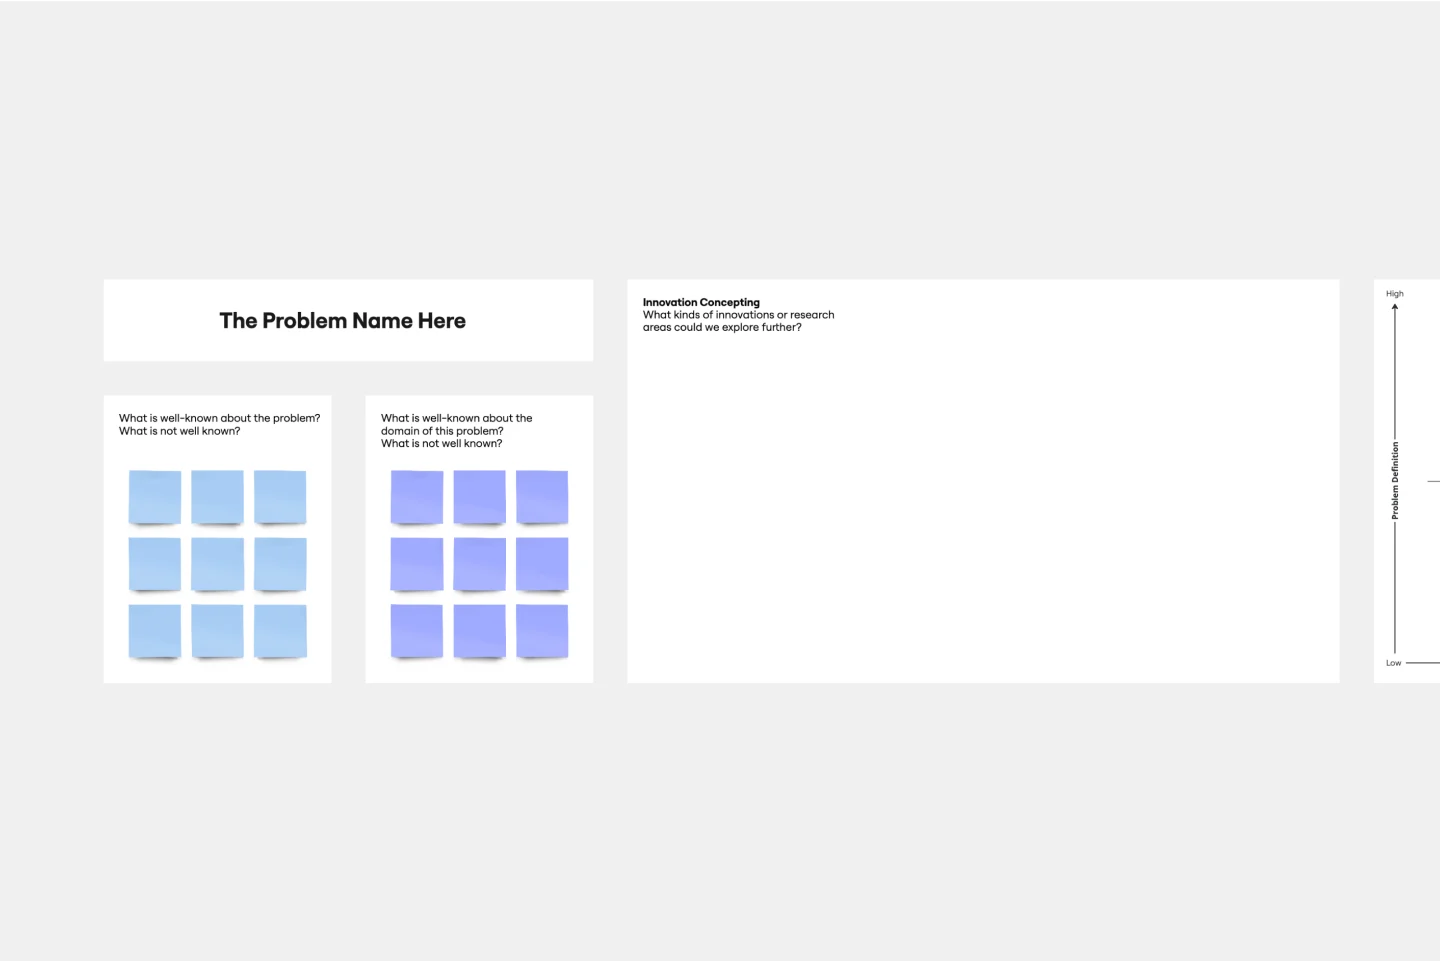
Innovation Matrix Template
Visualize the best way to grow your business with this Innovation Matrix template. It’ll show you how to streamline your innovation, make the right decisions about which areas of your business to innovate, and manage the entire process. So if you want to figure out the best way to innovate in your business, an innovation matrix can help.
BCG Matrix Template
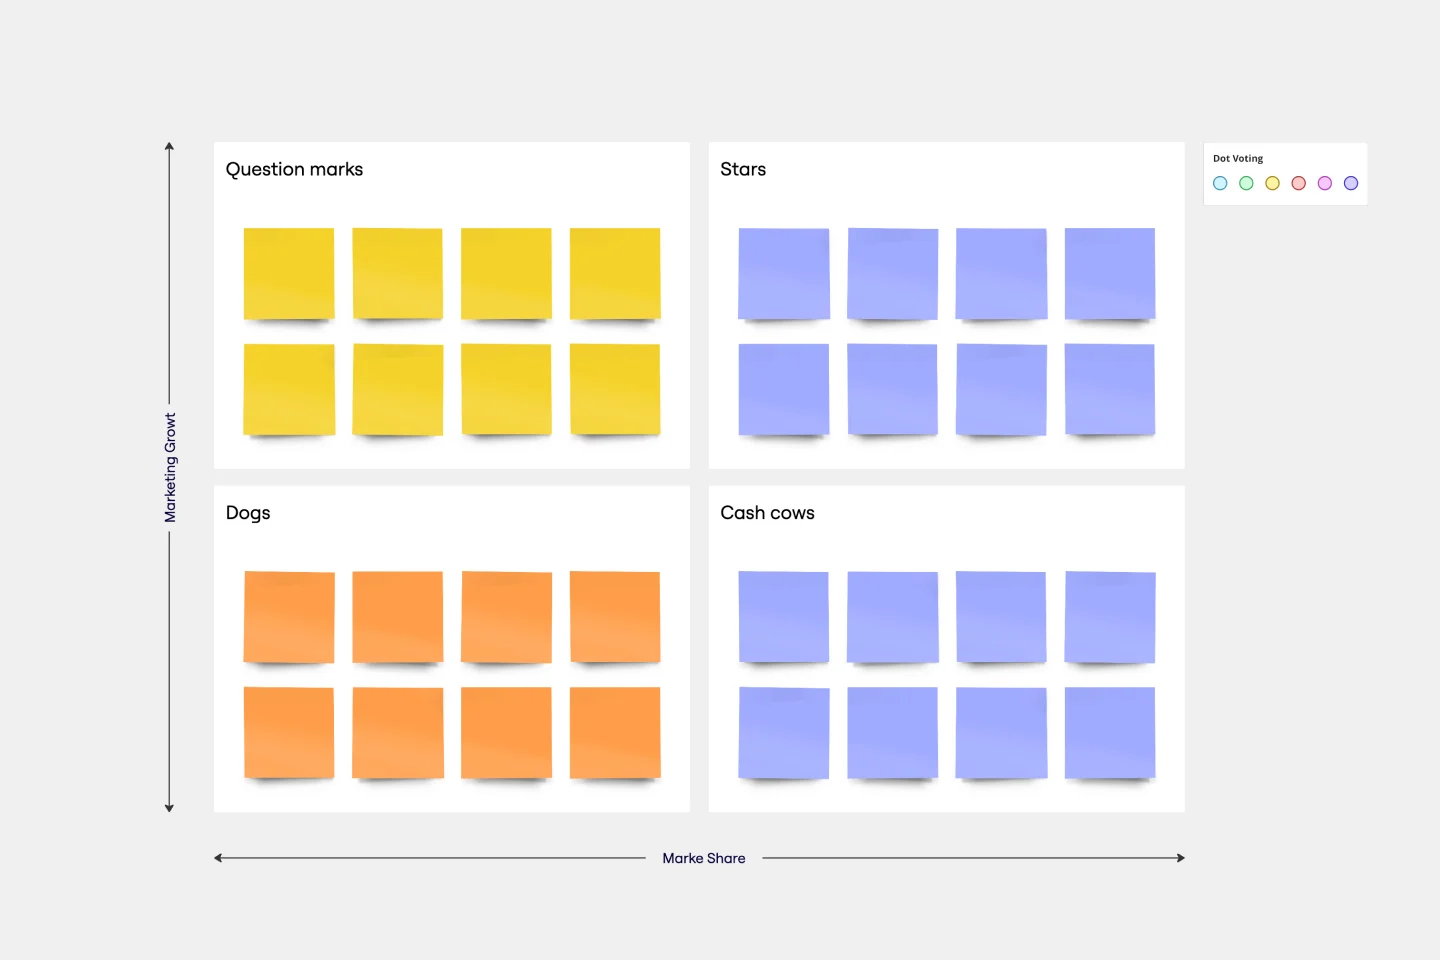
BCG Matrix Template
Use the BCG matrix template to make informed and strategic decisions about growth opportunities for your business. Assign your portfolio of products to different areas within the matrix (cash cows, dogs, question marks, stars) to prioritize where you should invest your time and money to see the best results.
Impact/Effort Matrix Template
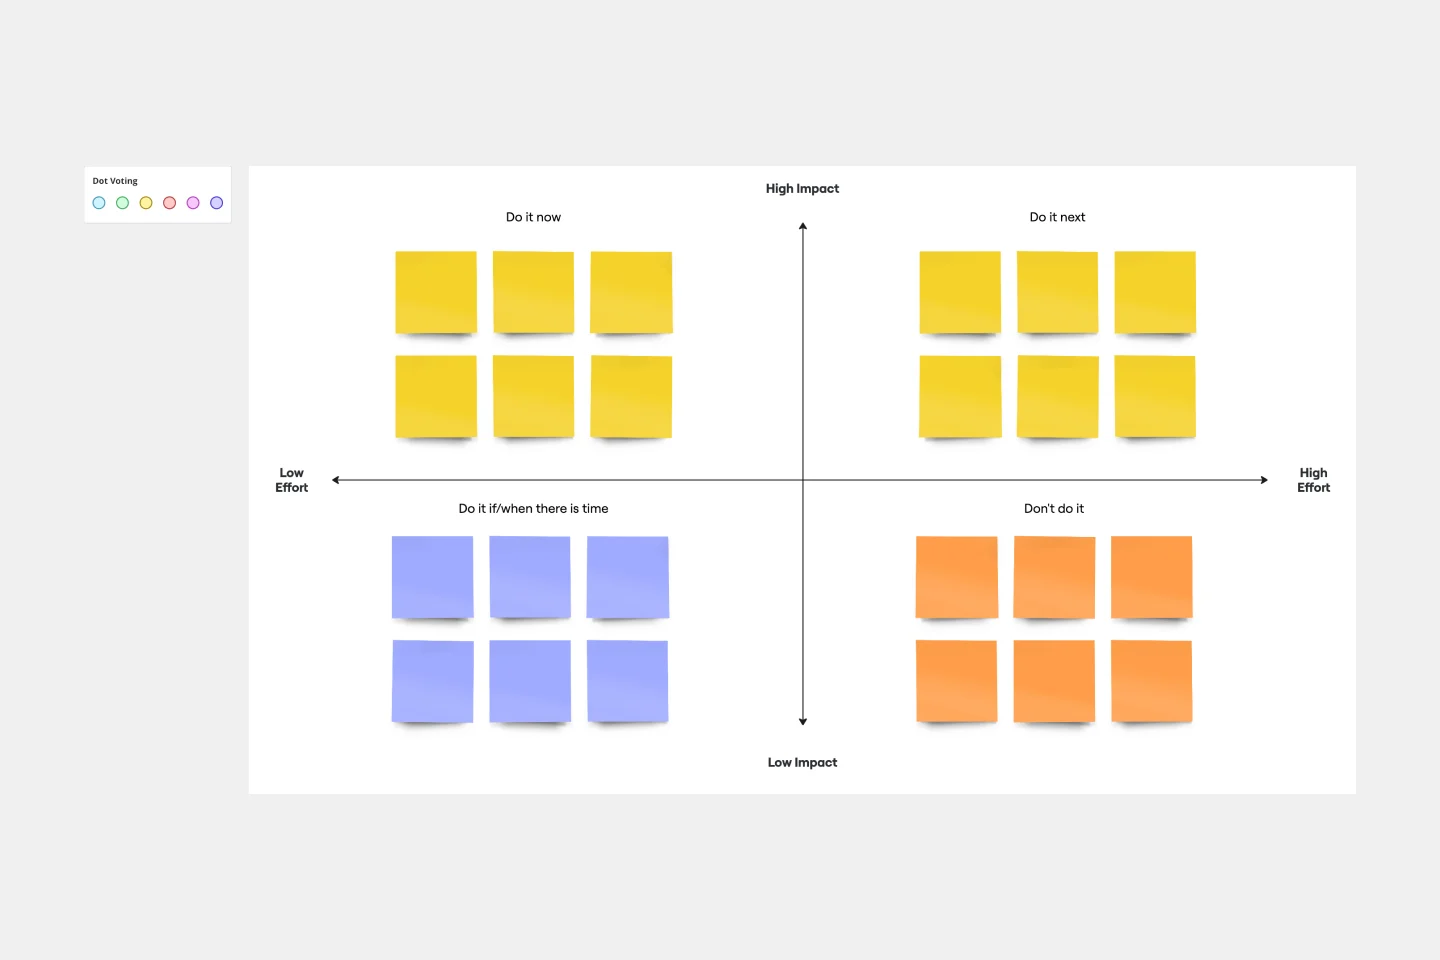
Impact/Effort Matrix Template
Growing organizations have countless to-do’s and only so many hours in a day (or weeks before a big launch) to get them done. That’s where an impact effort matrix comes in. It gives you a quick visual guide to help prioritize your tasks and know exactly what’s worth doing. Using our template, you can create a matrix that organizes your activities into four main categories: quick wins that are low effort, effort-intensive projects that provide long-term returns, fill-ins that are low effort but low value, and time-wasters.
Pugh Matrix Template
Pugh Matrix Template
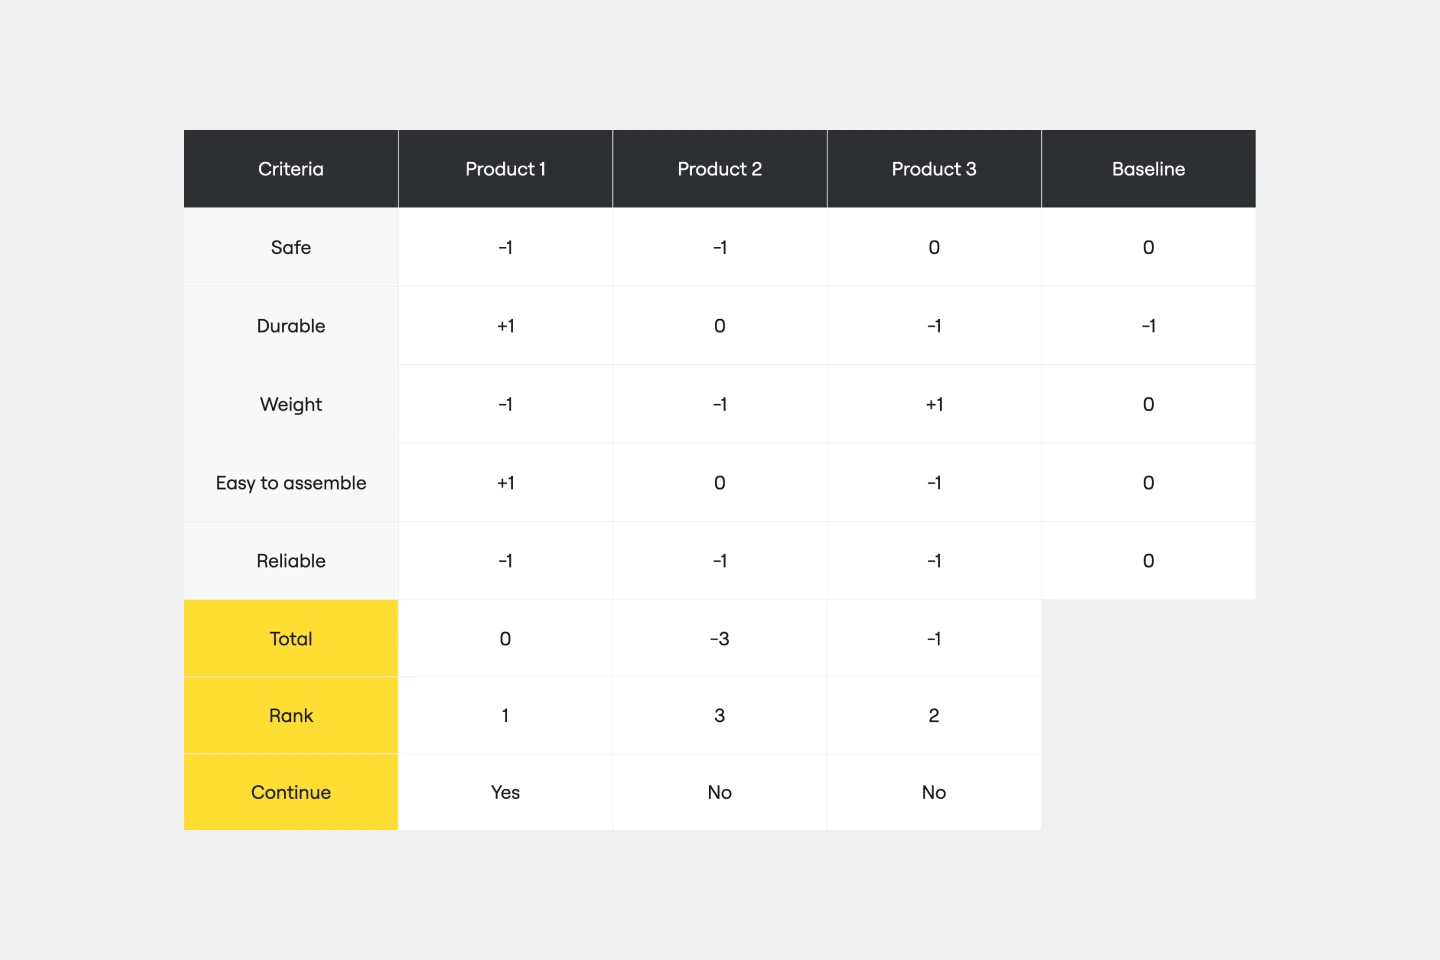
The Pugh Matrix Template is a powerful tool that enhances your decision-making process. It enables you to systematically compare and evaluate multiple options, leading to more informed and objective decisions. Using this template, you streamline your decision-making process, identify the best alternatives, and ultimately achieve better outcomes.
Eisenhower Matrix Template
Eisenhower Matrix Template
Have an overwhelming list of to-dos? Prioritize them based on two key factors: urgency and importance. It worked for American president Dwight D. Eisenhower, and it can work for you—this decision-making framework will help you know where to start and how to plan your day. With our template, you can easily build an Eisenhower Matrix with a quadrant of key areas (Do, Schedule, Delegate, and Don’t Do) and revisit it throughout the day as your priorities change.
Innovation Matrix Template
Innovation Matrix Template
Visualize the best way to grow your business with this Innovation Matrix template. It’ll show you how to streamline your innovation, make the right decisions about which areas of your business to innovate, and manage the entire process. So if you want to figure out the best way to innovate in your business, an innovation matrix can help.
BCG Matrix Template
BCG Matrix Template
Use the BCG matrix template to make informed and strategic decisions about growth opportunities for your business. Assign your portfolio of products to different areas within the matrix (cash cows, dogs, question marks, stars) to prioritize where you should invest your time and money to see the best results.
Impact/Effort Matrix Template
Impact/Effort Matrix Template
Growing organizations have countless to-do’s and only so many hours in a day (or weeks before a big launch) to get them done. That’s where an impact effort matrix comes in. It gives you a quick visual guide to help prioritize your tasks and know exactly what’s worth doing. Using our template, you can create a matrix that organizes your activities into four main categories: quick wins that are low effort, effort-intensive projects that provide long-term returns, fill-ins that are low effort but low value, and time-wasters.
Pugh Matrix Template
Pugh Matrix Template
The Pugh Matrix Template is a powerful tool that enhances your decision-making process. It enables you to systematically compare and evaluate multiple options, leading to more informed and objective decisions. Using this template, you streamline your decision-making process, identify the best alternatives, and ultimately achieve better outcomes.