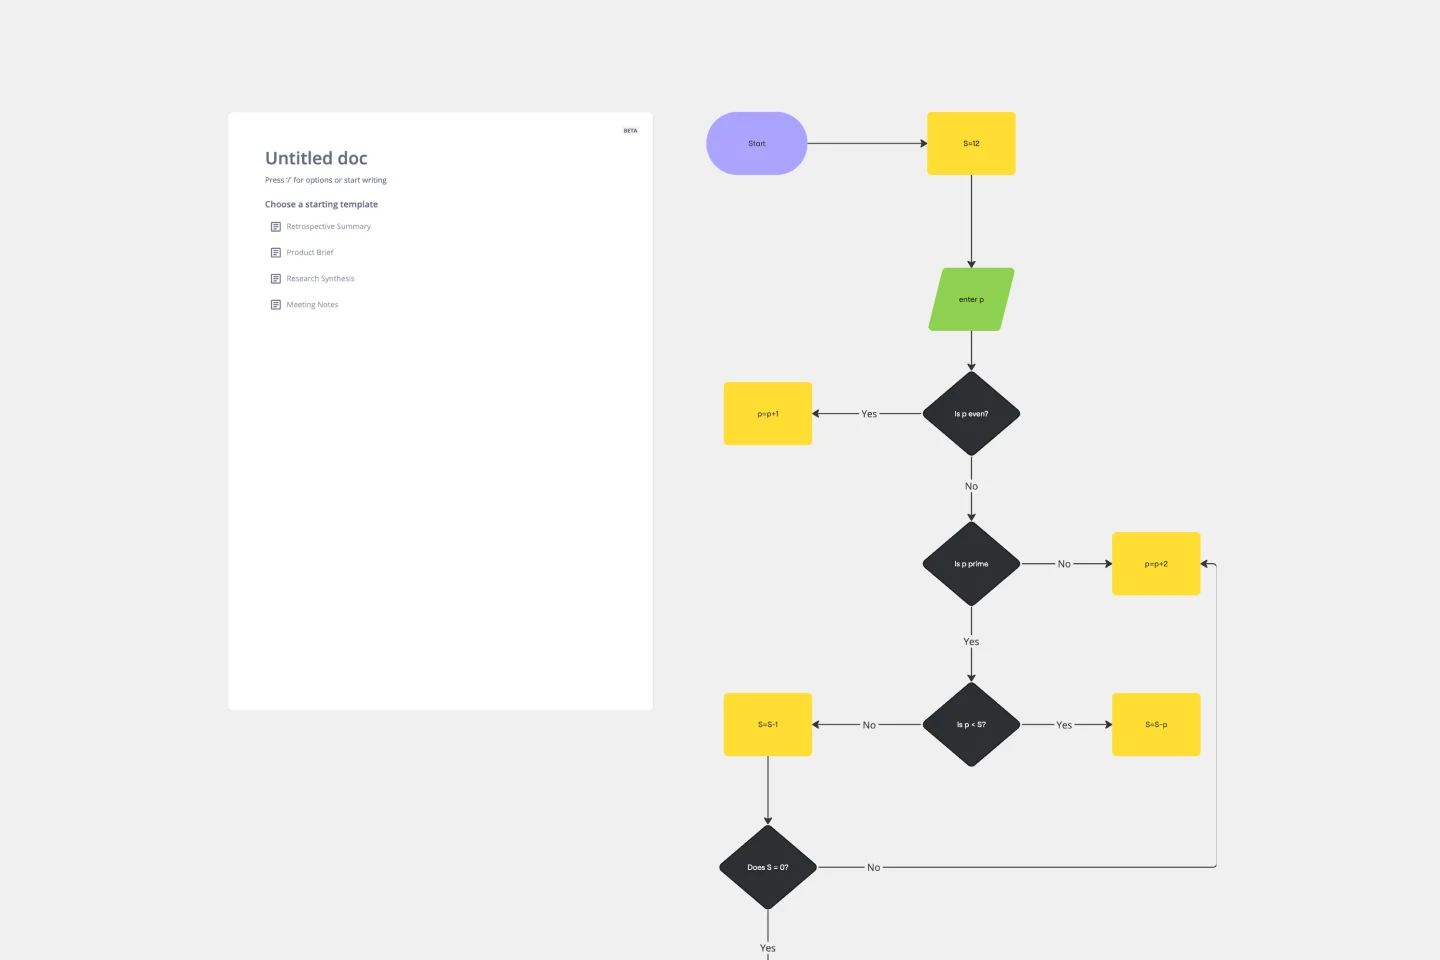
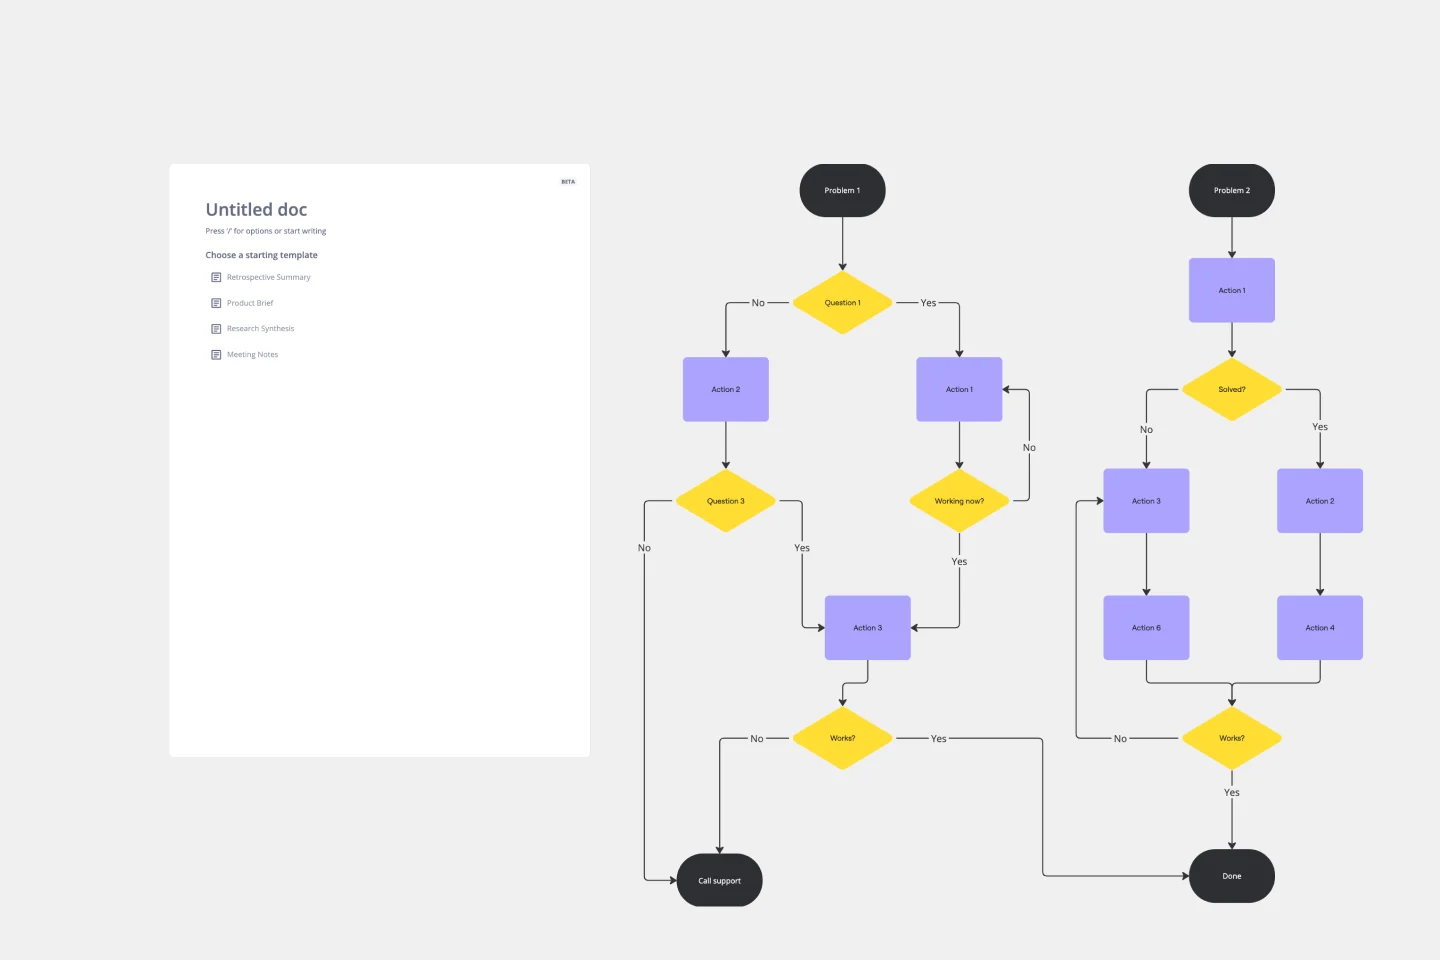
Algorithm Flowchart Template
Simplify the process of creating complex algorithms with the algorithm flowchart template.
About the Algorithm Flowchart Template
An algorithm flowchart is a graphical representation of a sequence of actions that make up an algorithm. It helps to streamline complex processes and make them easy to understand. Think of it as a blueprint that guides you through the logic of your algorithm, making it easier to go from problem to solution.
The algorithm flowchart template is a pre-designed framework that makes it easy to map out the process flow of an algorithm. It simplifies each step by breaking it down into individual components, represented by different shapes such as rectangles, diamonds, and ovals. Each shape represents a type of action or decision. By using clearly defined areas for input, operations, decisions, and outputs, users can methodically plot the course of their algorithm's logic. This tool is helpful for both beginners and experienced professionals.
How to use the algorithm flowchart template in Miro
Customize the flowchart: Double-click shapes to add your specific algorithm steps. The template is user-friendly, enabling you to edit text and shapes with just a few clicks.
Expand the diagram: Use automated diagramming features to drag and drop more shapes and connector lines, seamlessly expanding your flowchart.
Add context: Integrate any artifact on your board, such as notes, images, or links, to provide deeper insight into your algorithm.
The entire process is designed for efficiency and adaptability, ensuring your algorithm flowchart can grow and evolve as your project does.
Why use an algorithm flowchart template?
Clarity of complex processes: It transforms intricate algorithms into clear, visual steps, enhancing understanding for all stakeholders.
Efficiency in design: Saves time by providing a ready-made structure, which can be easily adjusted to fit various algorithms.
Collaboration: Fosters teamwork by allowing multiple contributors to view and edit the flowchart in real-time.
Reduce error: By laying out each step visually in a flowchart, potential issues can be identified and corrected early in the development process.
Documentation: The template acts as a dynamic document that can be referenced throughout the algorithm's lifecycle, from development to maintenance.
If you'd prefer to create an algorithm flowchart from scratch, Miro's flowchart tool is easy and intuitive to use.
Can the algorithm flowchart template handle complex algorithms with multiple conditions?
Absolutely. The template is designed to accommodate a variety of complexities, including algorithms with numerous conditions and branches.
Is it possible to export the flowchart for use in presentations or documents?
Yes, flowcharts created with the template can be exported and included in various document formats, making them suitable for presentations and reporting.
How does collaboration work with this template?
The template supports real-time collaboration. Multiple people can work on the flowchart simultaneously, making it perfect for team projects.
Are there any limits to how much I can customize the template?
There are no inherent limits. The template is fully customizable, allowing users to expand and change to meet their needs without restriction.
Get started with this template right now.
VRIO Analysis Template
Works best for:
Diagramming, Strategy
The VRIO Analysis Template is a framework that helps businesses evaluate their resources and capabilities for competitive advantage. It categorizes resources into four areas: Value, Rarity, Imitability, and Organization. This provides a comprehensive view of an organization's strengths and potential weaknesses. The template has the key benefit of offering quick visual insights. Decision-makers can immediately identify and focus on resources that are valuable, rare, hard to imitate, and well-organized. This ensures a sustainable competitive edge and saves time by avoiding lengthy textual analyses.
Turtle Diagram for BA
Works best for:
Diagramming
The Turtle Diagram for BA template offers a visual framework for defining and auditing business processes according to ISO 9001 standards. It provides elements for documenting process inputs, outputs, activities, and controls. This template enables organizations to ensure compliance, identify process improvements, and enhance quality management practices. By promoting systematic process documentation and auditability, the Turtle Diagram for BA empowers organizations to achieve and maintain ISO 9001 certification, demonstrating commitment to quality and continuous improvement.
Bull's Eye Diagram Template
Works best for:
Diagrams, Project Management, Prioritization
When you’re a growing organization, every decision can feel like it has make-or-break consequences—which can lead to decision paralysis, an inability to prioritize, inefficient meetings, and even low morale. If that sounds like you, put a Bull’s Eye Diagram to work. True to its name, a Bull’s Eye Diagram uses a model of concentric circles to help companies establish priorities, make critical decisions, or discuss how to remove or overcome obstacles.
ERD Healthcare Management System Template
Works best for:
ERD
The ERD Healthcare Management System Template streamlines the process of creating and managing entity-relationship diagrams for healthcare management systems. This template helps users visualize the complex relationships between different entities such as patients, healthcare providers, medical records, and billing information. It offers a flexible and customizable framework that can be adapted to fit the specific needs of any healthcare management system, ensuring clarity and efficiency in system design and database structure.
Azure Guidebook
Works best for:
Cloud Infrastructure
This Miro Board visualizes and connects all the necessary provisions for required resources in Azure DevOps, Microsoft Entra (formerly Azure Active Directory), and Azure.
BPMN 2.0
Works best for:
Diagramming
The BPMN 2.0 template offers a visual notation for modeling business processes using the Business Process Model and Notation (BPMN) standard. It provides elements for defining process flows, activities, and decision points. This template enables teams to document and analyze business processes systematically, facilitating process optimization and automation. By promoting standardization and clarity in process modeling, the BPMN 2.0 template empowers organizations to improve efficiency, agility, and compliance in their operations.