About the 3C Analysis Template
The 3C Analysis Template helps you assess your company's strengths, weaknesses, and opportunities and guides you in making informed decisions about your business strategy.
The template contains a framework for analyzing your company's internal and external environments—the three Cs stands for Company, Competitors, and Customers. The template helps you identify the key factors that affect each of these areas and understand how they impact your business.
Here are the three main three sections of the template:
The first section is the Company section, which covers your company's strengths, weaknesses, available resources, and capabilities.
The second section is the Competitors section, which requires you to analyze your competitors' strengths, weaknesses, and strategies.
The third and final section is the Customers section, which helps you understand your target market, including their needs, preferences, and behavior.
How to use the 3C Analysis Template in Miro
Using the 3C Analysis Template in Miro is straightforward. Here's how you can get started:
Step 1: Customize the template to fit your needs. Double-click on each shape to expand it and add your own content. You can also add more information to sticky notes and text boxes.
Step 2: Add any artifacts to your board to give more context. You can add images, videos, and documents to help you better understand your business environment.
Step 3: Collaborate with your team in real time. You can invite team members to view and edit your board, making it easy to work together and stay on the same page.
Why should you use a 3C Analysis Template?
There are several key benefits to using a 3C Analysis Template in your business strategy:
Helps you understand your business environment: The template provides a structured way to analyze your company's internal and external environments, helping you identify opportunities for growth and improvement.
Guides your business strategy: By analyzing your company's strengths, weaknesses, and opportunities, you can make informed decisions about your business strategy.
Helps you stay competitive: The template helps you understand your competitors, including their strengths, weaknesses, and strategies, allowing you to stay ahead of the competition.
Facilitates collaboration: Using the template in Miro makes it easy to collaborate with your team in real time, ensuring everyone is on the same page.
Saves time: By using a pre-made template, you can save time and focus on analyzing your business environment rather than creating a new framework from scratch.
Discover more gap analysis example templates for effective planning.
3C Analysis Template FAQs
Can I customize the template?
Yes, you can customize the template to fit your needs. Double-click on each shape to expand it and add your own content.
Can I collaborate with my team in real time?
Yes, using the template in Miro makes it easy to collaborate with your team in real time. You can invite team members to view and edit your board by sharing your board link.

Miro
Your virtual workspace for innovation
Miro is an innovation workspace designed for teams of every size, everywhere, to dream, design, and build the future together. Our mission? To empower these teams to create the next big thing, powered by AI at every step of the way. Over 90 million users around the world rely on Miro to untangle complex ideas, put customer needs first, and deliver products and services faster. All supported by best-in-class security, compliance, and scalability.
Categories
Similar templates
4C Analysis Template

4C Analysis Template
The 4C Analysis Template is a valuable tool for any business looking to gain a better understanding of their organization. Whether you are a small business owner or a large corporation, the template can help you identify areas for growth and develop more effective strategies.
Force Field Analysis Template

Force Field Analysis Template
A Force Field Analysis Template is a powerful tool that helps teams identify and analyze the forces supporting or hindering progress toward a specific change or goal. This template provides a visual space where you can brainstorm and plot out 'driving forces' that push objectives forward and 'restraining forces' that prevent advancement, all on a single, intuitive board. One of the primary benefits of utilizing the Force Field Analysis template is that it fosters a shared understanding among team members. By visually mapping out and discussing each force, teams can prioritize efforts, build consensus on the central issues to tackle, and collaboratively devise strategic plans to strengthen positive influences while reducing negative ones.
VRIO Analysis Template

VRIO Analysis Template
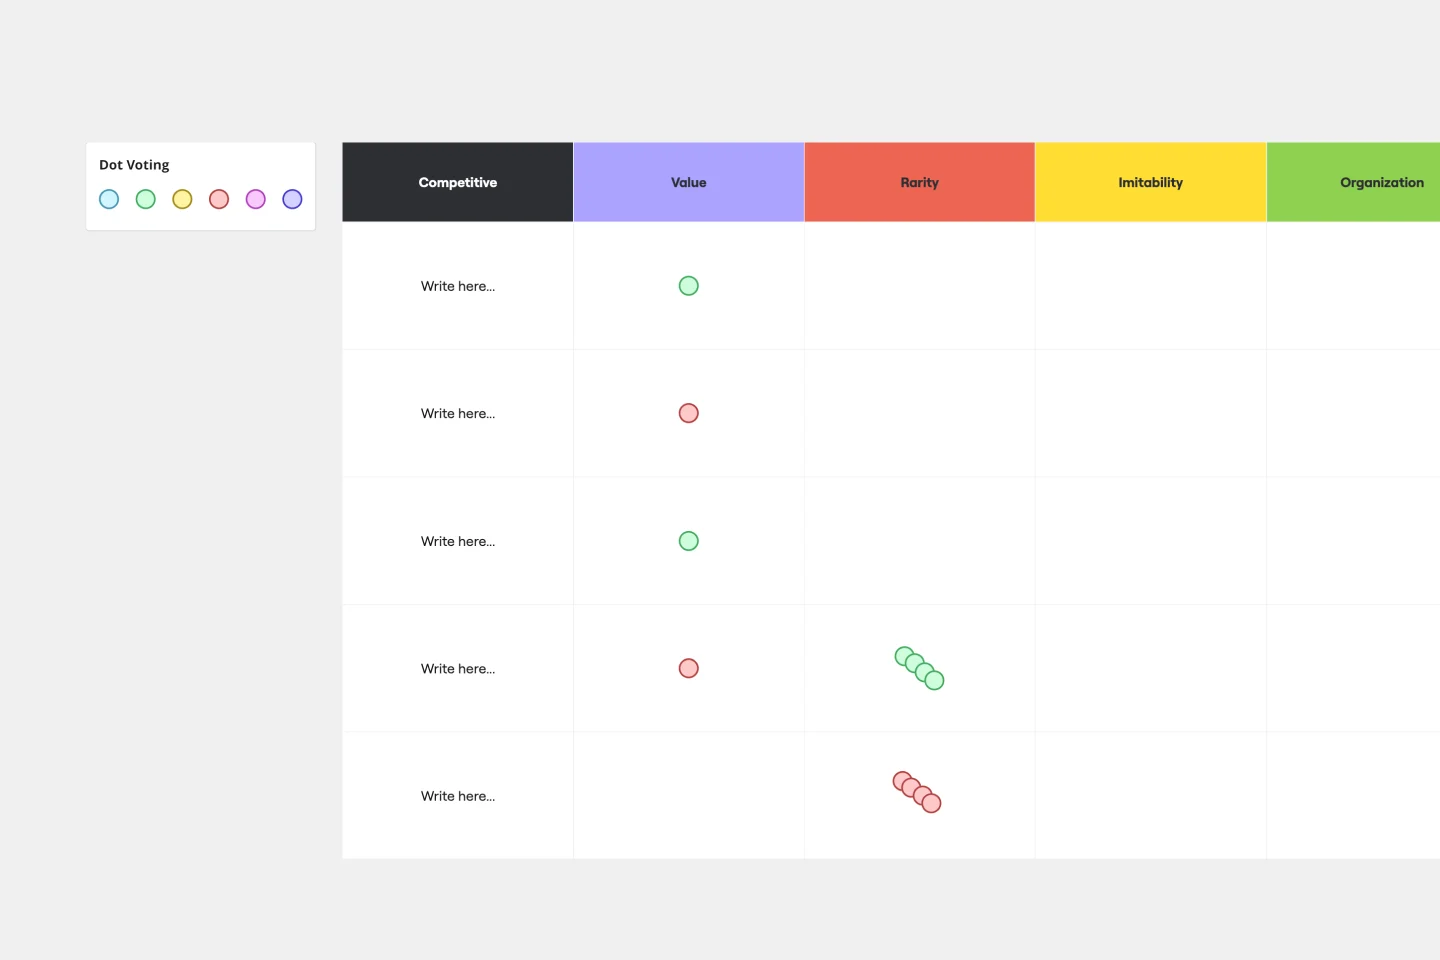
The VRIO Analysis Template is a framework that helps businesses evaluate their resources and capabilities for competitive advantage. It categorizes resources into four areas: Value, Rarity, Imitability, and Organization. This provides a comprehensive view of an organization's strengths and potential weaknesses. The template has the key benefit of offering quick visual insights. Decision-makers can immediately identify and focus on resources that are valuable, rare, hard to imitate, and well-organized. This ensures a sustainable competitive edge and saves time by avoiding lengthy textual analyses.
Task Analysis Diagram Template

Task Analysis Diagram Template
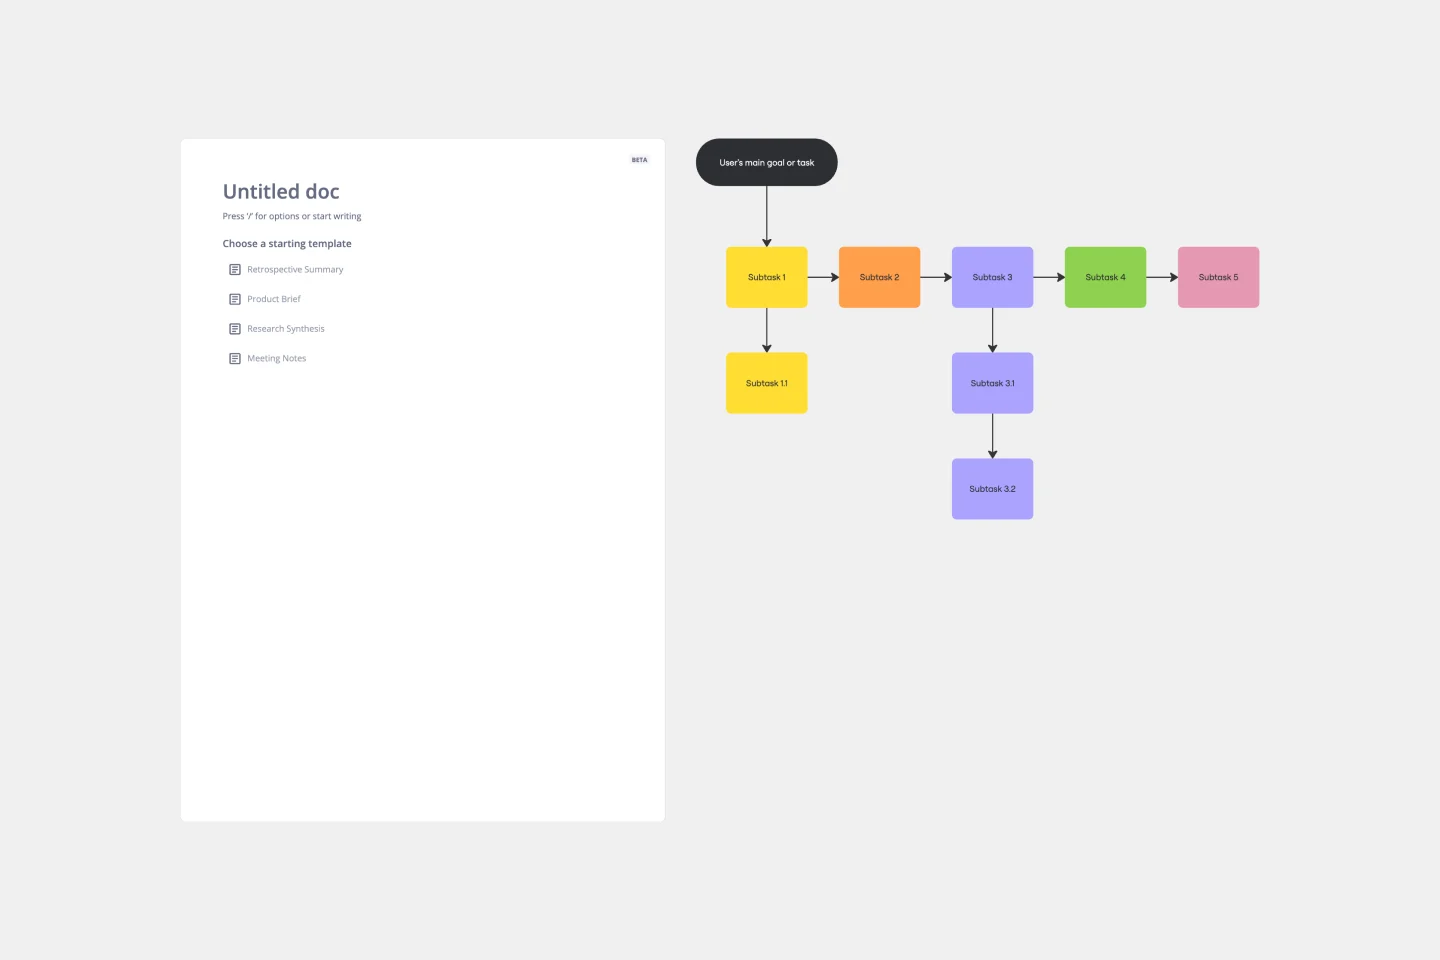
The Task Analysis Diagram Template is a helpful tool that simplifies complex tasks by breaking them down into smaller, more manageable steps. This strategic approach brings clarity and ensures a systematic method for tackling complex user paths. The template's most significant advantage is its precision, as it maps out every detail of a task to guarantee that nothing is missed. This results in more efficient operations.
4C Analysis Template

4C Analysis Template
The 4C Analysis Template is a valuable tool for any business looking to gain a better understanding of their organization. Whether you are a small business owner or a large corporation, the template can help you identify areas for growth and develop more effective strategies.
Force Field Analysis Template

Force Field Analysis Template
A Force Field Analysis Template is a powerful tool that helps teams identify and analyze the forces supporting or hindering progress toward a specific change or goal. This template provides a visual space where you can brainstorm and plot out 'driving forces' that push objectives forward and 'restraining forces' that prevent advancement, all on a single, intuitive board. One of the primary benefits of utilizing the Force Field Analysis template is that it fosters a shared understanding among team members. By visually mapping out and discussing each force, teams can prioritize efforts, build consensus on the central issues to tackle, and collaboratively devise strategic plans to strengthen positive influences while reducing negative ones.
VRIO Analysis Template

VRIO Analysis Template
The VRIO Analysis Template is a framework that helps businesses evaluate their resources and capabilities for competitive advantage. It categorizes resources into four areas: Value, Rarity, Imitability, and Organization. This provides a comprehensive view of an organization's strengths and potential weaknesses. The template has the key benefit of offering quick visual insights. Decision-makers can immediately identify and focus on resources that are valuable, rare, hard to imitate, and well-organized. This ensures a sustainable competitive edge and saves time by avoiding lengthy textual analyses.
Task Analysis Diagram Template

Task Analysis Diagram Template
The Task Analysis Diagram Template is a helpful tool that simplifies complex tasks by breaking them down into smaller, more manageable steps. This strategic approach brings clarity and ensures a systematic method for tackling complex user paths. The template's most significant advantage is its precision, as it maps out every detail of a task to guarantee that nothing is missed. This results in more efficient operations.