What is a Gantt Chart? Definition, benefits and how to use one

Summary
In this guide, you will learn:
What a Gantt chart is: a horizontal bar chart that visualizes project tasks against a timeline to manage and track progress effectively
The key components of a Gantt chart, including tasks, timelines, milestones, dependencies, and assignees
How Gantt charts improve project management by clarifying schedules, showing task dependencies, and facilitating resource allocation
How to create and customize a Gantt chart in Miro using templates, including adding tasks, setting dates, defining dependencies, and assigning team members
The collaborative features of Miro’s Gantt chart tool that enable real-time updates, team communication, and stakeholder engagement
Integration capabilities with other tools like Jira and G Suite to keep project information up to date within the Gantt chart workspace
Gantt chart definition and structure explained
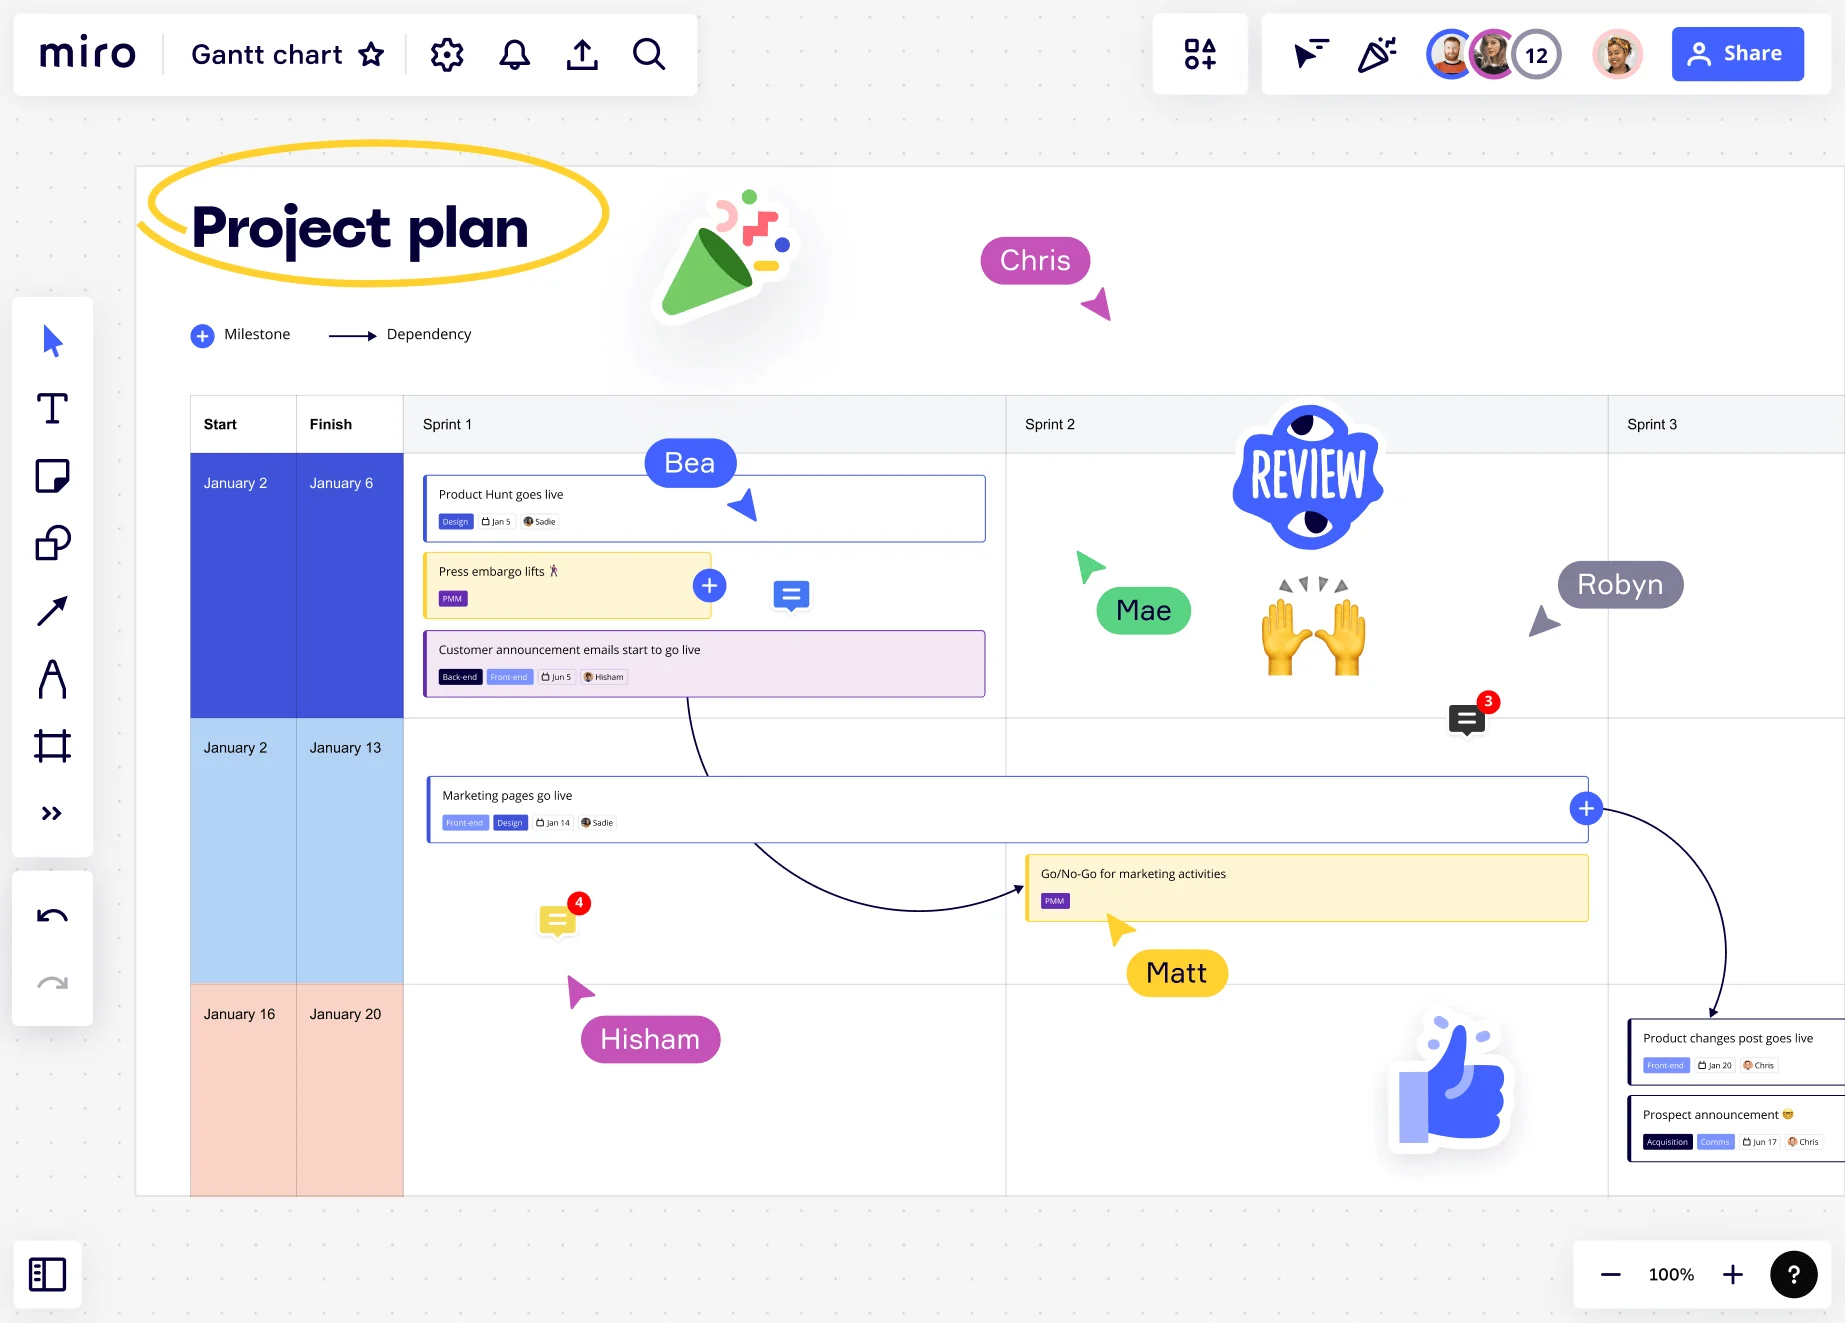
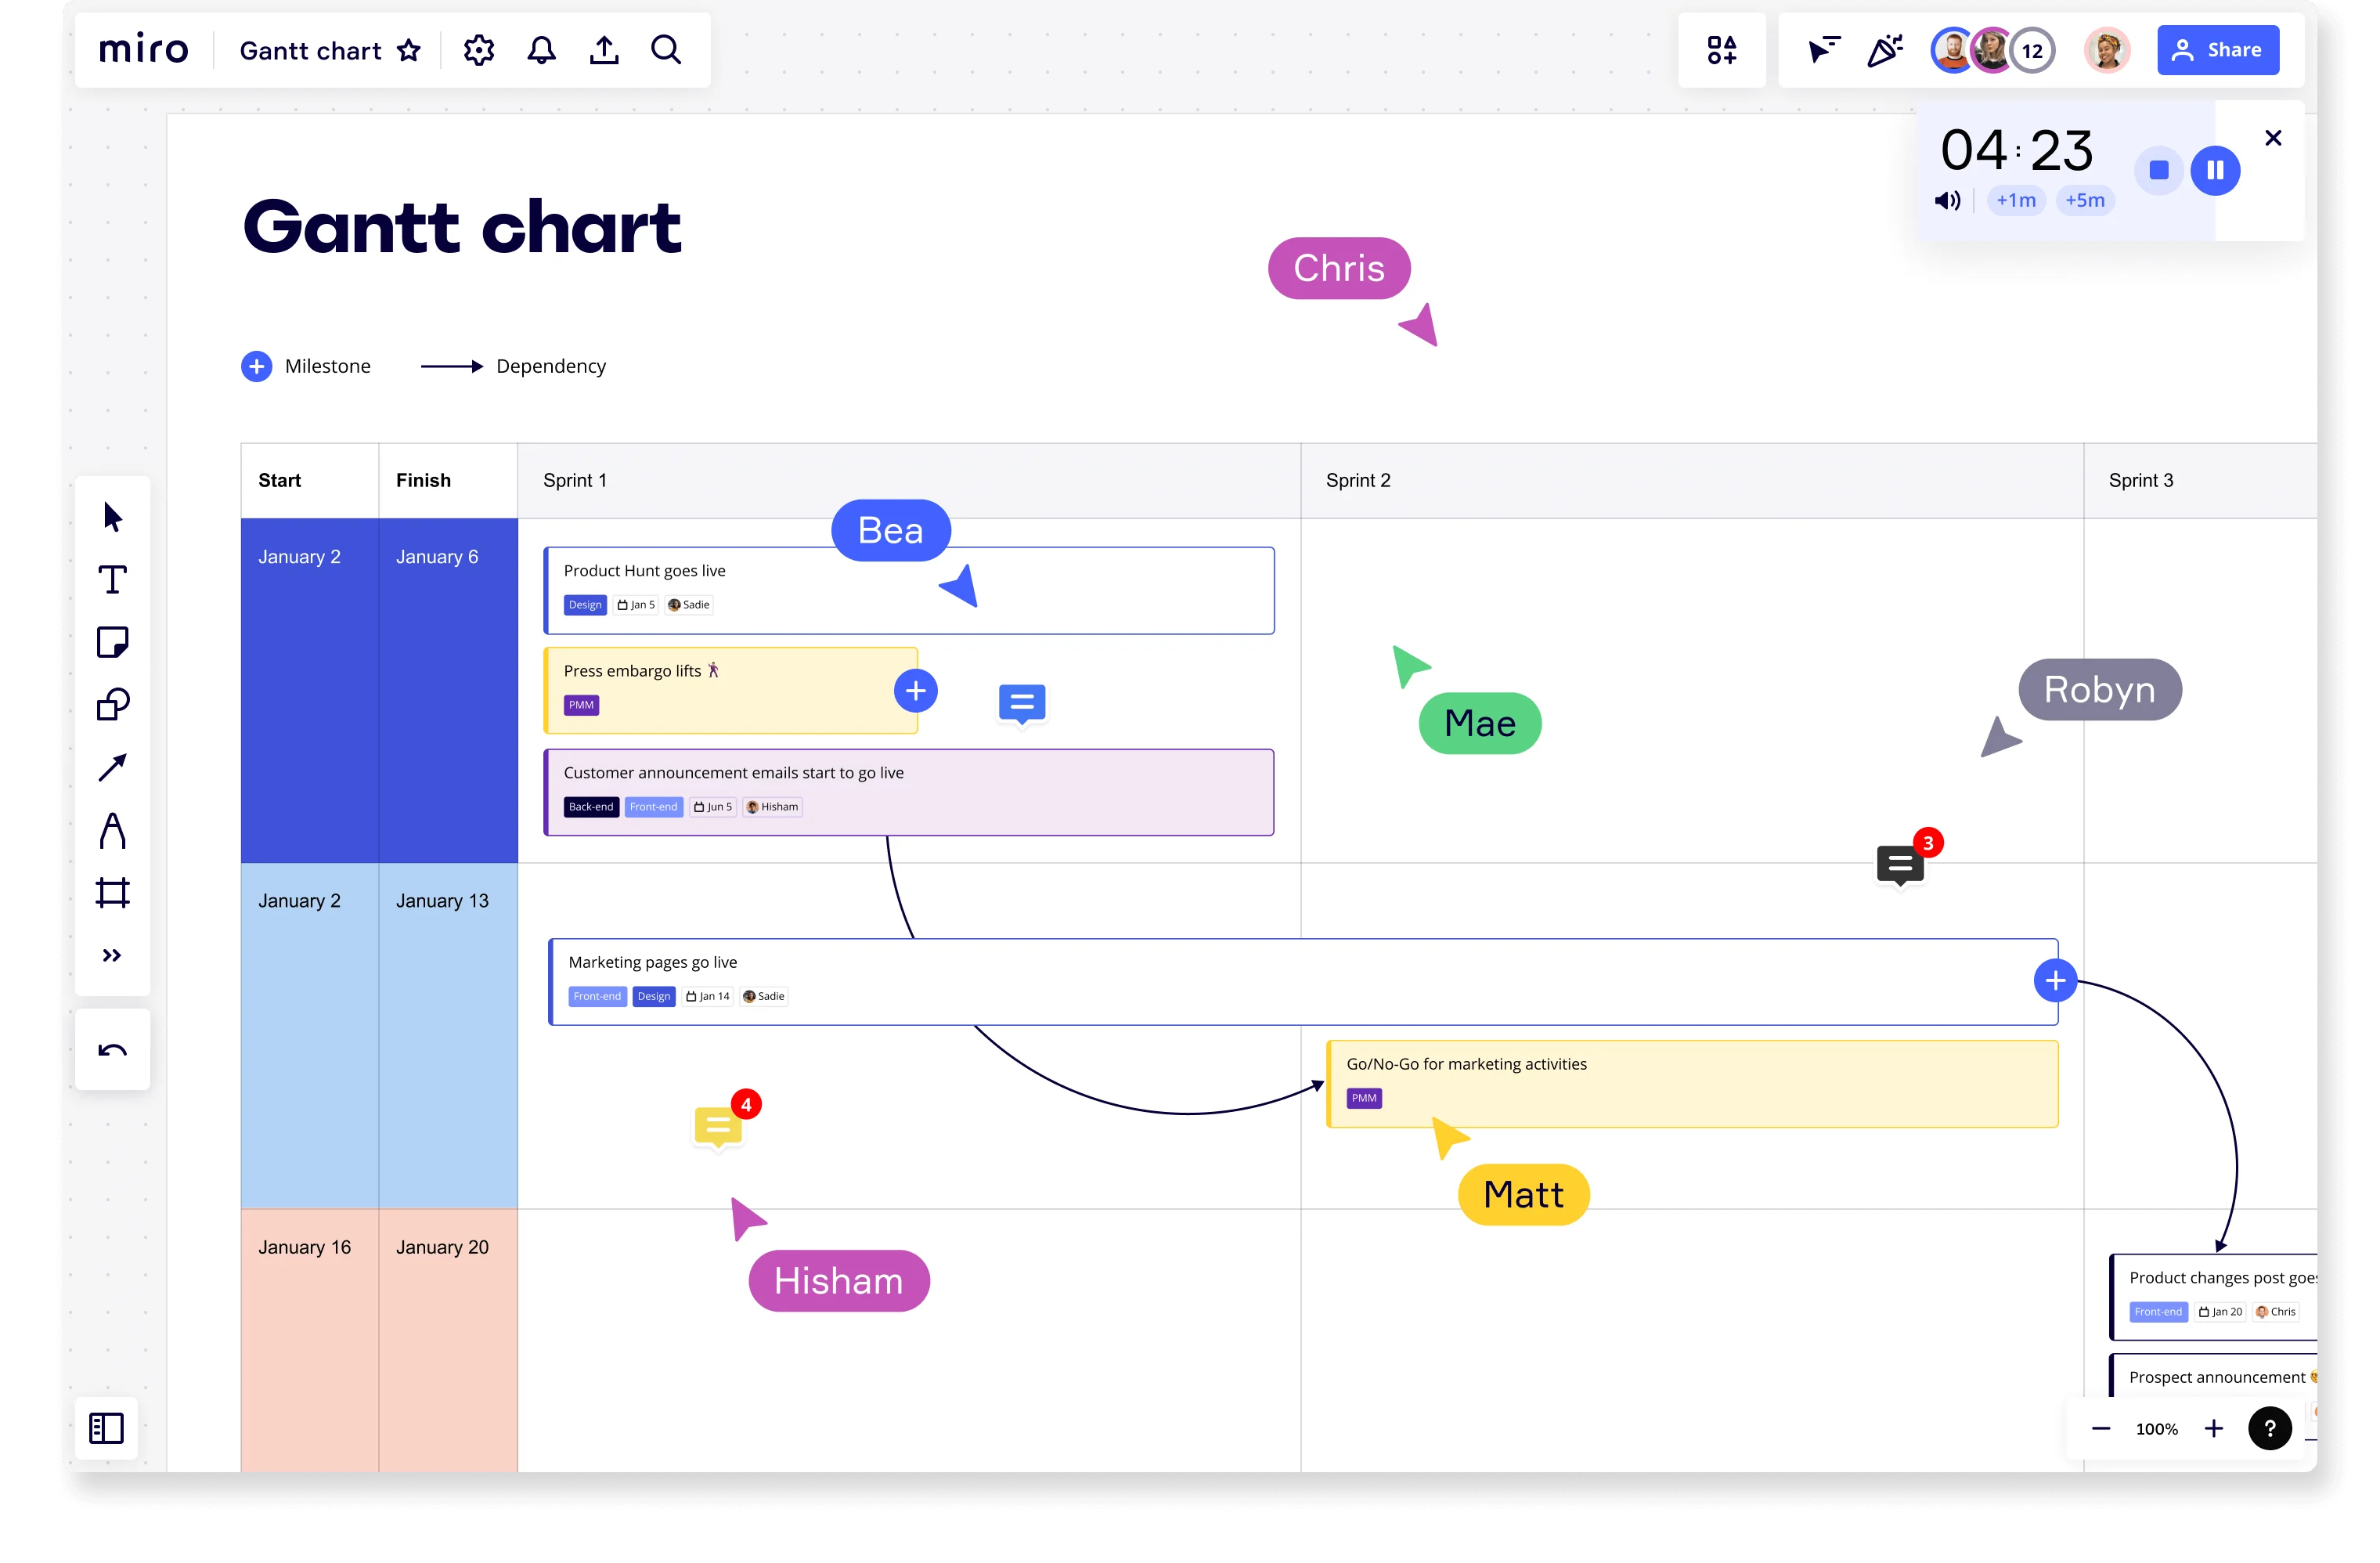
A Gantt chart is a tool for organizing and managing projects. It’s a horizontal bar chart that outlines all of a project’s tasks against a timeline. Creating a Gantt chart helps project managers visualize the required tasks and keep track of their project’s progress.
The chart is named after its creator, Henry Gantt, who developed it in the early 20th century to show a project schedule. He used these graphs for systematic and routine operations, such as managing employee productivity.
Today, using a Gantt chart in project management is helpful for many reasons. They allow project teams to better manage their tasks, improve resource allocation, and identify dependencies.
The structure of a Gantt chart typically includes two sections. The horizontal axis outlines the individual tasks, while the vertical axis shows the timeline for the work. Bars are then added to the chart to represent each task’s duration.
Gantt charts can also include milestones, assignees, and dependencies between tasks (more on this later).

What are the main benefits of using a Gantt chart?
Gantt charts are an essential tool for keeping your projects on track and delivering results. Below are some of the main benefits of using a Gantt chart in more detail:
Effectively organize project tasks
A Gantt chart’s simple structure makes it easy to organize your project tasks. You simply add the tasks to the chart, schedule their start and end dates, and slot them into the project in the right order.
A Gantt chart’s format also allows project teams to see all the tasks in one location, helping them track progress and organize the project’s structure.
Identify dependencies
Dependencies are a series of tasks that determine the sequence of work. For a project to move forward, dependent tasks must be completed in a certain order. Not doing this can hold up the entire project.
For example, let’s say your project has three dependent tasks: A, B, and C. Task B can’t start until Task A is complete, meaning Task B is dependent on Task A. On top of this, Task C can’t start until Task B is complete.
Project managers can use Gantt charts to identify these dependencies. The bar chart structure makes it easier to spot these tasks and track them as the project progresses. You can also add arrows between dependent tasks to make the sequence clear for the rest of the project team.
Improve team collaboration
A Gantt chart helps project teams collaborate. Its structure is easy to understand, meaning everyone can see what tasks they’re responsible for, who’s responsible for other tasks, and how each person’s work feeds into the bigger picture.
To further improve collaboration, you can use an online platform to create and share your Gantt chart with the project team and other stakeholders.
Creating a Gantt chart online allows remote and hybrid teams to work together virtually to deliver the final project. It also means project teams always have access to the most up-to-date version of a project. They can access the Gantt chart in real time to see how things are progressing and what they need to do to keep things moving forward.
What makes a good Gantt chart?
Here are some key components that’ll help you get the best possible results from your Gantt chart:
Clarify your project goals
You need to be clear about your project goals before you create a Gantt chart. If you’re not, you might find yourself lacking the direction you need to complete the project.
The good news is that there are methods you can use to create clear project goals. Take a look at the SMART goals framework templates as an example. SMART is an acronym for specific, measurable, attainable, relevant, and timely. It encourages you to think strategically about your goals to ensure they’re as clear and relevant as possible.
Understand which tasks are critical
Critical tasks are activities that’ll delay a project’s end date if they’re not completed on time. Identifying these tasks within your Gantt chart can help you improve task prioritization, create a realistic project timeline, and make sure your project stays within budget.
You can use the program evaluation and review technique (PERT) to identify critical tasks in a project. Take a look at our PERT Diagram Template to find out more.
Clearly define tasks
Although Gantt charts can provide a high-level overview of your project, you still need to define the required tasks clearly. If a team member arrives at a task that doesn’t have enough information, they’ll have to talk to another team member to get a better understanding.
This can slow down a project’s progress, so it’s important that all tasks are clear.
If you’re using Miro to create your Gantt chart, you can add detailed information within each taskbar. Simply click the bar, and a popup window will appear. In this window, you can write a task description, add tags, change the bar colors, and update the task’s status.

How to create a Gantt chart for a project
We’ve outlined some simple steps you can follow to create your own Gantt chart, starting with reviewing the project scope.
Review the project scope
Before you create your Gantt chart, you need a clear picture of the project scope.
The project scope outlines key aspects of your project. It includes your project’s goals, deliverables, requirements, tasks, costs, and deadlines. It’s usually a document, but it can also be in a different format.
Take a look at our Project Scope Template to see the project scope in a Kanban structure.
Understanding your project’s scope puts you in a good position to create a successful Gantt chart.
You’ll have a clear picture of what the project involves, what the goals are, and why the project’s happening. As a result, you’ll be able to add all the relevant tasks, deadlines, and milestones to the chart.
Add project tasks
After reviewing the project scope, you can start adding project tasks to the Gantt chart. This is where the bars come into play.
Each bar in a Gantt chart represents a different task and its duration. Depending on your Gantt chart’s structure, these bars can also show what the task involves and who it’s assigned to.
You can also categorize tasks based on the type of work. For example, you could separate tasks into the following departments:
Sales
Marketing
Finance
Operations
Product development
IT
Splitting tasks into different categories gives you a better overview of a project. It also makes it easier for different teams to see which tasks they’re responsible for — which is particularly useful if your project is complex. By categorizing tasks, teams can easily see which tasks are relevant to them instead of seeing every single task in the project.
Set a time frame
With all the tasks now in the chart, you can add the duration for each task. If you’re using an online platform like Miro, you can select a start and finish date in the template. Then, the bar will automatically jump to the correct place in the chart.
If you don’t know how much time to estimate for each task, don’t worry. There are different ways to estimate task duration, including the following:
Understand what the task involves
You first need to know what activities are required to complete the task. What is the desired outcome? Is the task complex? Are multiple people required? All of this information will help you judge how long the task should take.
Review historical data
Take a look at previous projects to see how long tasks have taken in the past. You can use this information to estimate how long your current project tasks should take.
Talk to assignees
If you have little or no experience in some areas of the project, it’s a good idea to talk to people from that area of work. They’ll have the insights you need to help you determine how long each task should take.
Request approval from key stakeholders
After all the tasks are in the chart, you’ll have a clearer picture of how long the entire project will take to complete. You can share this information with key stakeholders to keep them in the loop and ask for their approval before moving forward.
Once the project timeline is agreed upon, you can add the information to the project charter. Documenting this information helps prevent scope creep, which can cause delays and prevent you from completing the project.
Identify dependencies
Now that your Gantt chart has the go-ahead, you can pinpoint dependencies. This means spotting tasks that can’t move forward until other tasks have started or are completed.
Most of the time, dependencies will become obvious when you map all your project tasks. If they’re not, you’ll need to look for tasks you can’t perform until certain events within a previous task take place. Once this is mapped out, you can add arrows between dependent tasks to show which tasks are critical to the project’s completion.
Share it with your project team
When the Gantt chart is finished, share it with your project team for their review. This allows your team to ask questions and provide feedback on the project.
If you’re using Miro to manage your Gantt chart, you can simply share the chart with your project team and they can add comments directly to the chart. That way, it’ll be easier for you to review their feedback.
Launch the project
With everyone on board, you can finally launch the project. But the work isn’t over yet.
As the work progresses, you’ll need to refer to the Gantt chart to track the project’s progress. This will help you to address any issues that might have cropped up and make sure you’re on track for project delivery.
When it comes to checking project progress, using an online chart tool can be helpful. It allows you to check tasks’ progress in real time and quickly put things right if they’re not going to plan.
It also means that your project team can always access the most up-to-date version of the chart. They can instantly see how the project is going, which tasks they still need to complete, and the tasks other team members are working on.
Author: Miro Team Last update: August 12, 2025