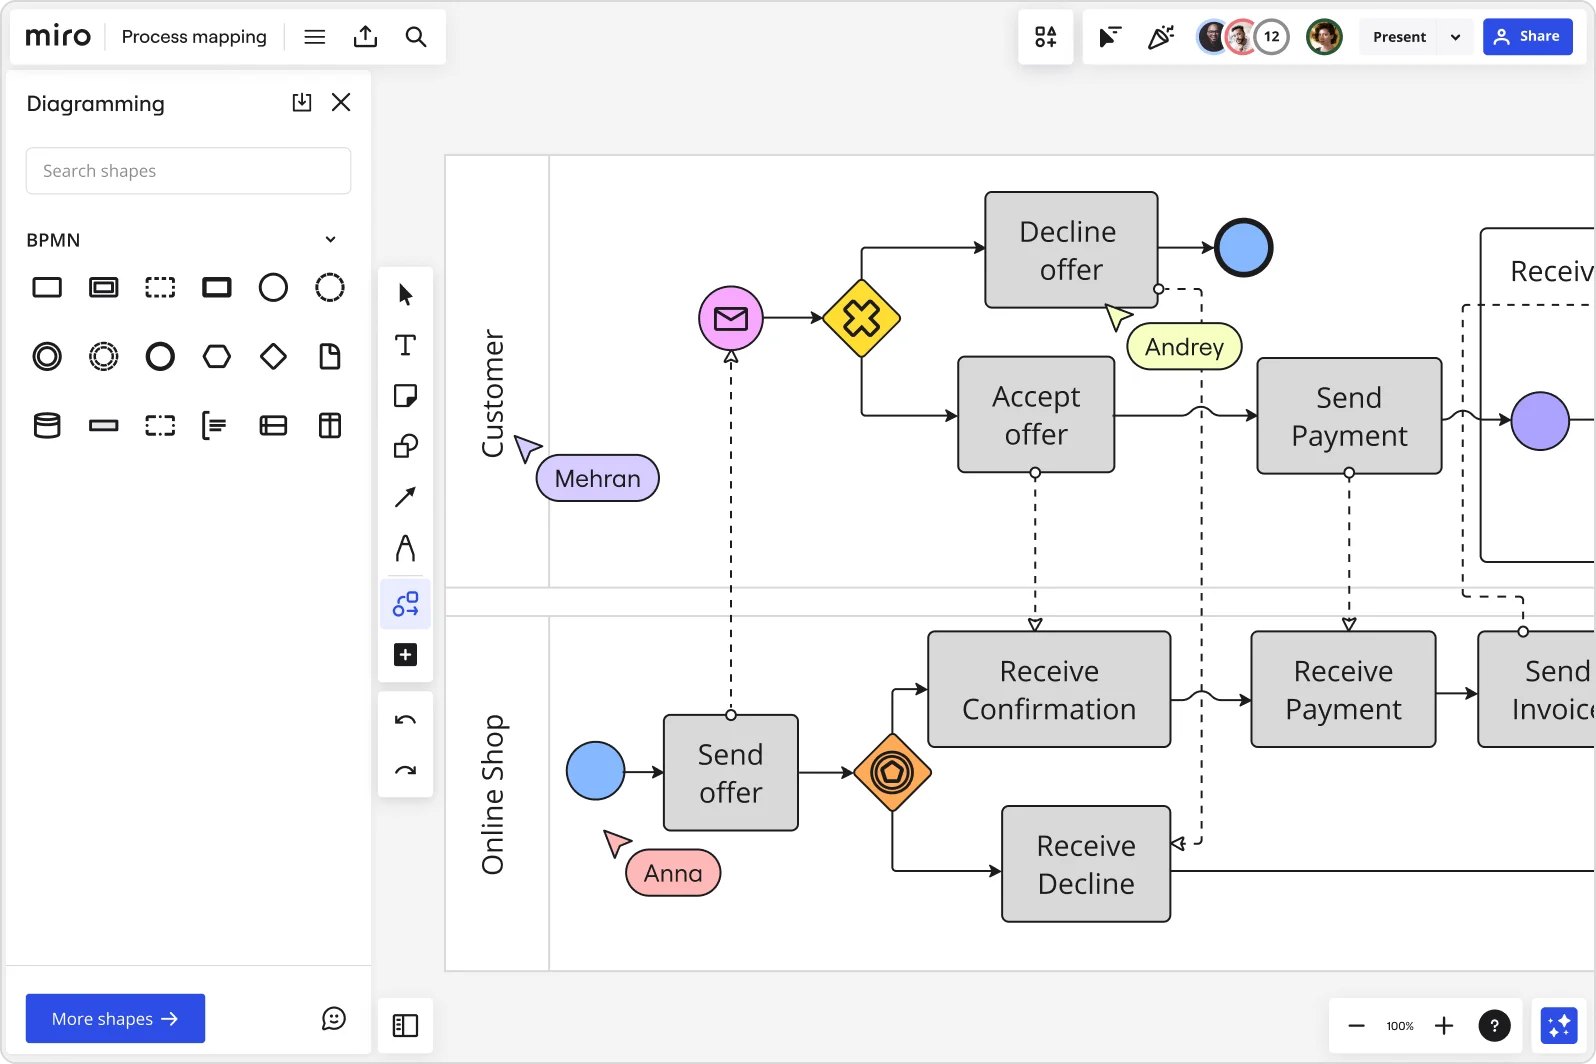
What is process mapping?

Summary
In this guide, you will learn:
What process mapping is and its role in visualizing workflows
The key symbols used in process maps
How to define and organize process steps
Techniques for mapping decision points and identifying bottlenecks
How to use Miro’s process mapping tools
Examples of applying process mapping in various projects
Try Miro now
Join thousands of teams using Miro to do their best work yet.
Process mapping explained
Here’s the truth: You can benefit from visualizing even the simplest of processes.
Think about doing something straightforward and intuitive — like making a sandwich. Anyone who’s made a sandwich knows it’s just about putting different ingredients between two slices of bread.
But imagine if you were to break down the process of making a sandwich into its various steps. We’re willing to bet you’d find ways to be even more effective and efficient — like grabbing all of your ingredients at once rather than taking multiple trips back to the fridge.
That’s essentially what process mapping is for. It’s about understanding your current processes and how to optimize them.
What is a process map?
Now that you have a better idea of what a process map is for, let’s get a clear definition. A process map is a versatile tool that helps you visualize your workflow to improve efficiency. More specifically, it’s a visual exercise where you draw (or, you know, map) out your workflows into a flowchart. Think of it much like any other map — it’s a visual resource showing you where to go next.
For project managers, creating a process map helps visualize all the contingencies of a project and identify dependencies, which is especially helpful when working with cross-functional teams. It’s also great for identifying areas for improvement. You can pinpoint bottlenecks, repetition, and delays in your processes — and, as a result, fix these issues.
We’ll take a closer look at the benefits of process mapping in the next section.
Why is process mapping important?
Process mapping can benefit your team in many ways. Here are a few specific advantages:
1. It keeps everyone aligned
Process mapping is about more than simply explaining processes. It’s about providing a visual reference for people to turn to on the job. And when there’s one main source of truth everyone can refer to, your team is more likely to stay on the same page — keeping everyone aligned and maintaining a sense of consistency across the quality of work.
2. It supports day-to-day work
We all deal with processes to perform our jobs — whether you’re a content writer who deals with a publishing process or a designer who goes through cycles of feedback and iteration. But when you’ve got multiple processes to keep up with, having clear process maps at your fingertips comes in handy. Having a visual guide to turn to any time you get stuck on the job allows you to find the information you’re missing more quickly — minimizing blockers in your day-to-day work.
3. It improves communication
Process mapping isn’t just useful for those directly involved in them. It also helps provide documentation for the rest of the organization, allowing anyone to be able to quickly identify important processes, how they work, and who the main stakeholders are. In other words, it reduces any friction when it comes to cross-team communication, speeding up the flow of information in your organization.
4. It keeps processes in check
With a clear overview of how your processes work, you and your team are more equipped to review them from time to time and identify opportunities for improvement. In the long run, it makes it easier to keep your processes in check and make sure that your team is working effectively and efficiently.
Process map symbols
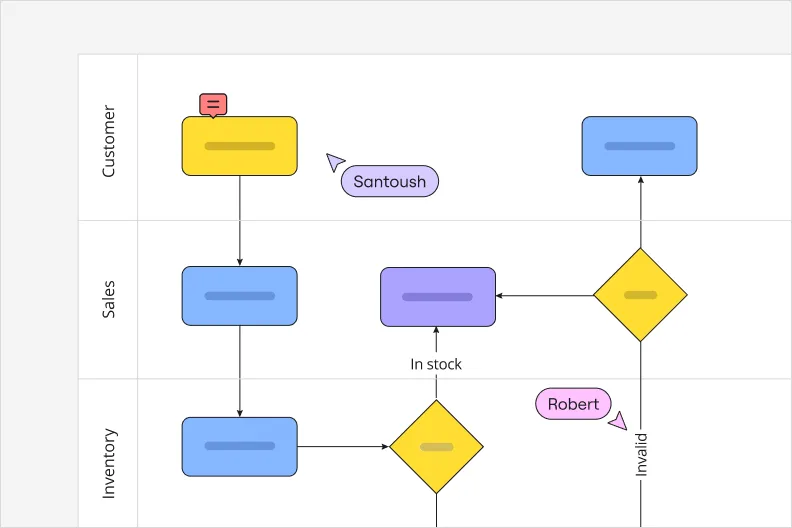
Remember, process mapping is a visual exercise. That means you won’t want your diagram to be cluttered with big blocks of text — that would make it harder to get the information you need at a glance.
That’s why process map symbols (also called process symbols or flowchart shapes) can be so helpful. These icons help you portray an idea or divulge a piece of information without having to explicitly write it out.
Here’s the good news: You have the freedom and flexibility to come up with symbols that work well for you and your team.
That said, there are a few default symbols that you’ll see on a lot of different process maps based on the Unified Modeling Language (UML) — a standardized format for creating process maps. So it’s worth getting familiar with them. Some common process map symbols include:
Terminator
Depicted by an oval, the terminator typically represents your process map's entry and exit points.
Process
A rectangle often represents a process symbol, indicating a task or step you need to take.
Arrow
An arrow – or a line – shows the direction a process map flows in — as well as the relationships between different shapes.
Decision
Represented by a diamond, the decision symbol indicates any decision that gets made during the process. Arrows that flow from here usually carry the following labels: true, false, yes, or no.
Delay
As the name implies, a delay symbol indicates a delay in the process, highlighting pauses or slowdowns. It usually comes as a D-shape — half a rectangle, half an oval.
Subroutine
Represented by a rectangle with double vertical lines, a subroutine symbol indicates a set of detailed actions within a larger process.
Preparation
Often shown as a hexagon, a preparation symbol represents an initial step that sets up others in the process.
Input and output data
Information or objects that enter or leave the process are known as input and output data. These often come in the form of parallelograms.
Document
A rectangle with a wavy bottom represents a document symbol. You’d include it anytime a step results in a document getting produced.
Stored data
Any step in the process where data gets stored – including data management – uses the stored data symbol. It’s usually a cylinder.
Database
A database refers to any structured collection of data. Just like stored data, you’d also use a cylinder to represent it on a process map.
Regardless of the symbols you decide to use, make sure that you document them and share them with your team so that you can all use them consistently. After all, symbols are only helpful when everybody understands what they mean.
Process mapping examples
Now that we’ve painted a picture of what a process map looks like, let’s look at a few different ways you could use a process map.
Here are three process mapping examples in particular:
1. Pizza delivery process
One way you could use a process map is to explain the various steps involved in carrying out a pizza delivery — from when a customer places their order to when they’ve received their pizza. Here’s what each stage of the process might look like and what symbols you’d use to represent them on the map:
Terminator (oval) — the customer places an order, either online or on the phone
Process (rectangle) — the kitchen staff gets to work preparing the pizza based on the order
Process (rectangle) — the pizza bakes in the oven to perfection
Process (rectangle) — a staff member boxes the pizza up and hands it over to the delivery person
Arrow (line) — the delivery person travels to deliver the pizza to the customer
Process (rectangle) — a delivery person successfully delivers the pizza to the customer
Terminator (oval) — the delivery is complete.
At a glance, this process map provides a clear start and end point using ovals, and a sequence of rectangles and arrows visualizing every step. You can also add arrows to connect more of the shapes, visualizing the order of the steps and any other important connections.
2. Employee onboarding process
Imagine a process map visualizing the various steps you could take to onboard a new employee — from the moment HR receives their documents to the moment the employee completes their first week on the job. Here are some steps you could include and the symbols you’d use for each stage:
Terminator (oval) — the new hire submits their documents to HR upon signing their contract
Process (rectangle) — HR processes the documents in the company’s system
Process (rectangle) — IT prepares the new hire’s laptop and workstation
Arrow (line) — the new hire travels to the office to pick up their IT equipment and have their first day
Process (rectangle) — the new hire’s manager conducts orientation for their entire first week
Terminator (oval) — the new hire completes their first week on the job.
This process map uses rectangles to represent each key action in the employee onboarding process, with arrows guiding the flow and ovals marking the start and end points.
3. Hospital appointment process
Here’s how you might use a process map to visualize the various steps involved in checking a patient in at the hospital — from the moment they arrive to the moment they’ve completed their visit:
Terminator (oval) — the patient arrives at the hospital and heads to the reception desk
Process (rectangle) — The patient notifies the receptionist that they’d like to check in
Process (rectangle) — the patient takes vital tests with a nurse (i.e. heart rate, blood pressure)
Arrow (line) — the nurse delivers the readings to a doctor to prepare for the examination
Process (rectangle) — the patient meets with the doctor for a consultation
Decision (diamond) — the doctor decides if the patient needs to take more tests
Process (rectangle) — the patient schedules a follow-up appointment depending on the doctor’s decision in step 6
Terminator (oval) — the patient’s visit is complete
Like the previous two examples, this map uses ovals to mark a clear start and end point, and rectangles to visualize various stages of the process. But the diamonds imply that you’ll need to make decisions in order to determine how you’ll complete the process.
Types of process maps
Chances are, you’ve already used process maps without realizing. That’s because you could use a few different types of diagrams for process mapping. Here are a few of the most common types:
Flowchart
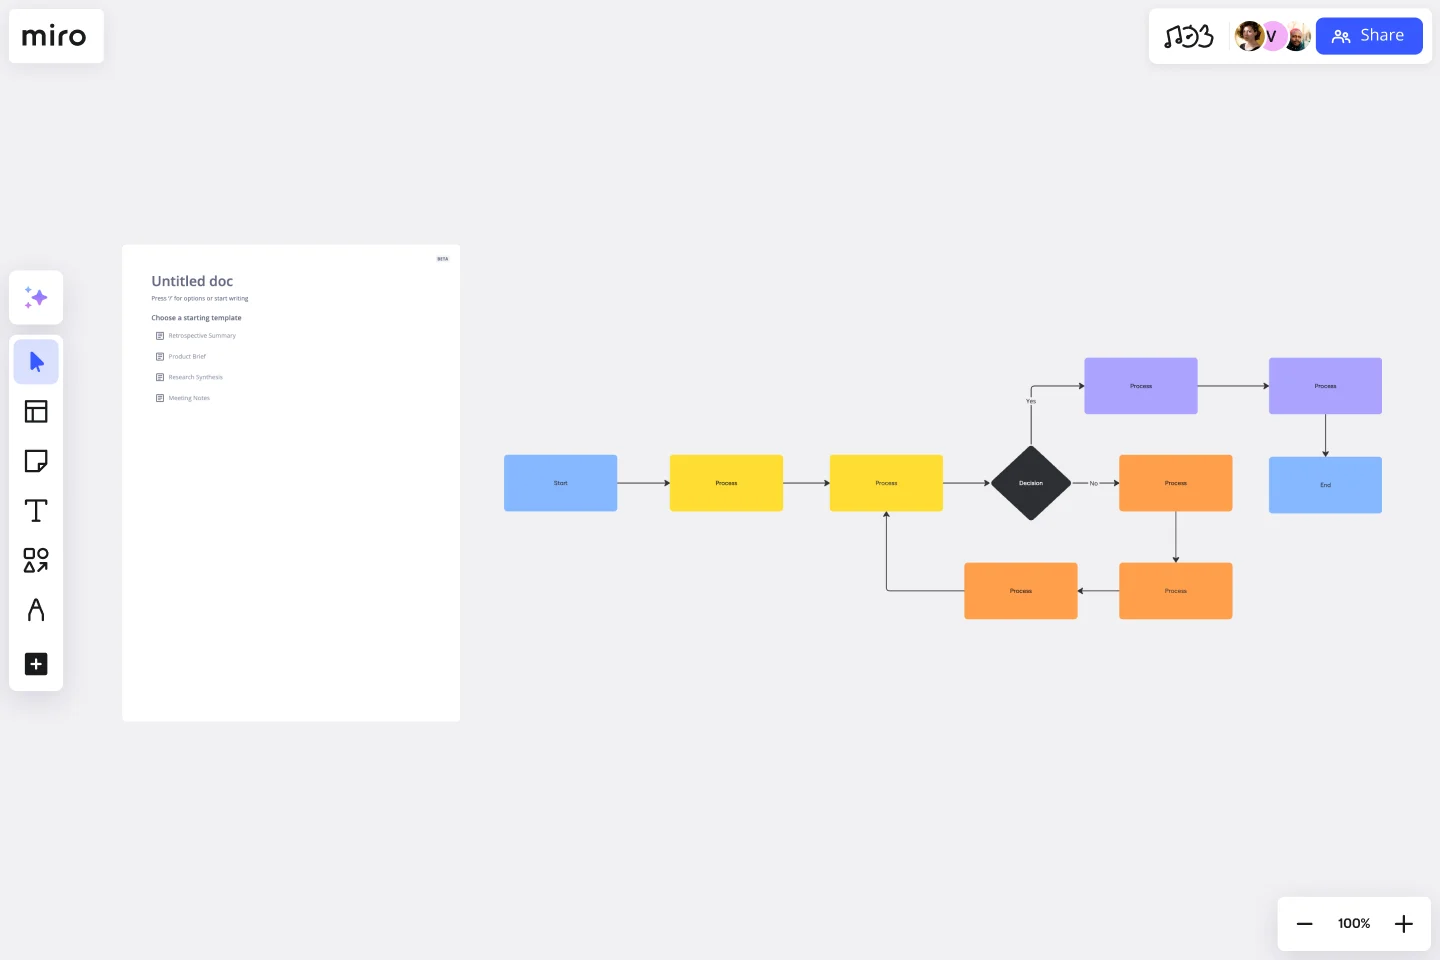
You’ve probably seen your fair share of flowcharts before. It’s the simplest version of a process map, where you follow different lines and choices to work your way through a process.
Business process mapping
Business analysts and technical developers use BPMN diagrams to thoroughly overview business processes. The aim is to create a shared understanding of your business’s procedures, which means this diagram helps streamline communication and improve productivity across the organization.
Swimlane diagram
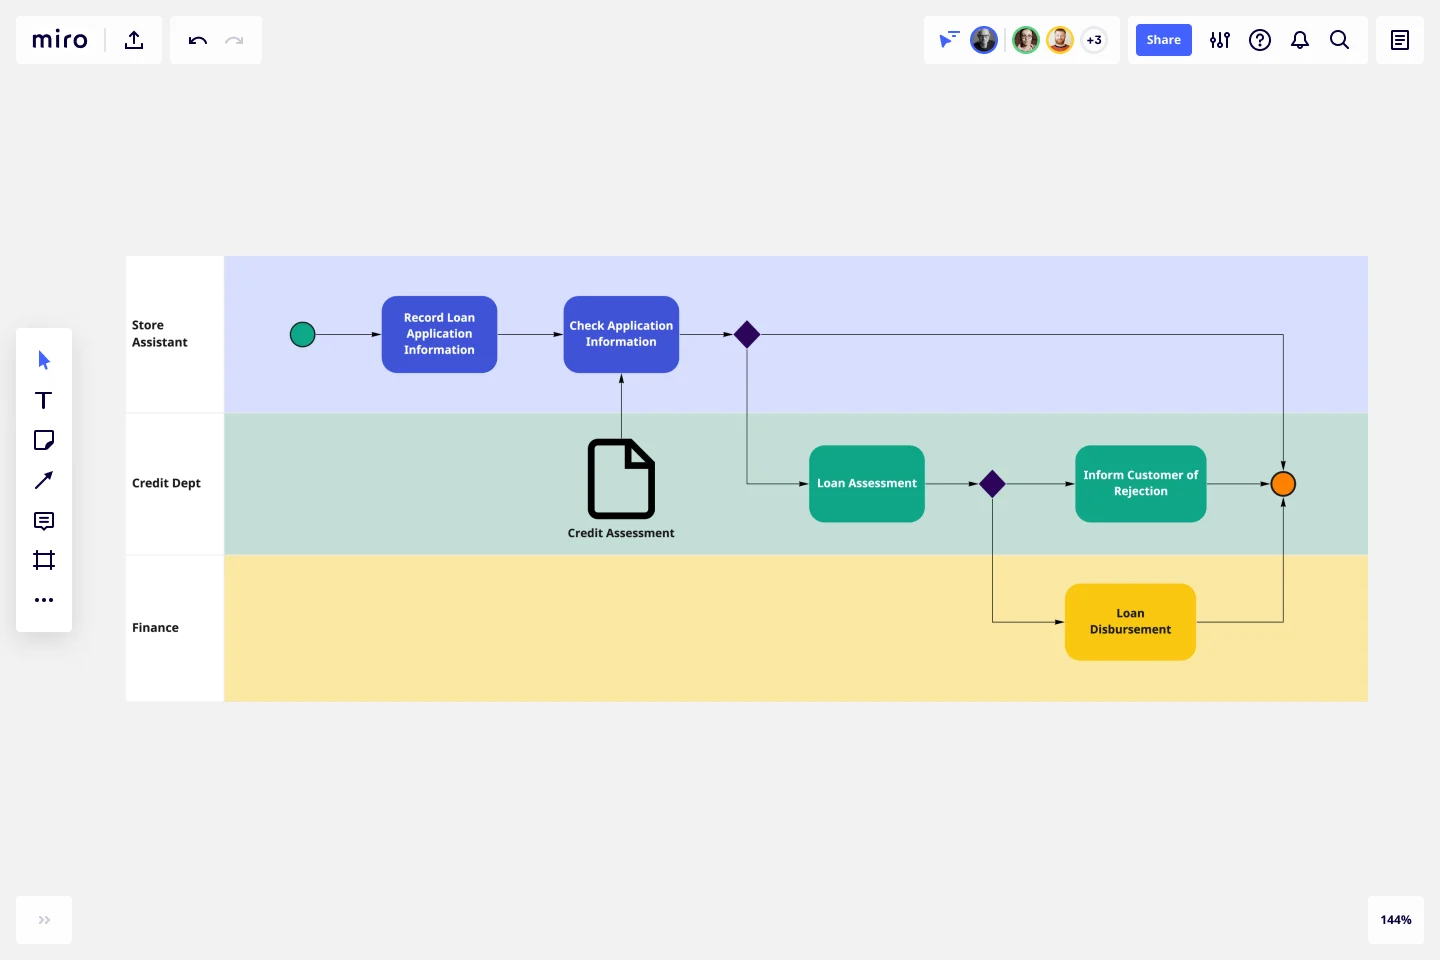
A swimlane diagram, also frequently called a deployment map, outlines processes with particular emphasis on who’s responsible for what. Each person or team gets their own “lane” on the map where their specific tasks and responsibilities get plotted.

Value chain diagram
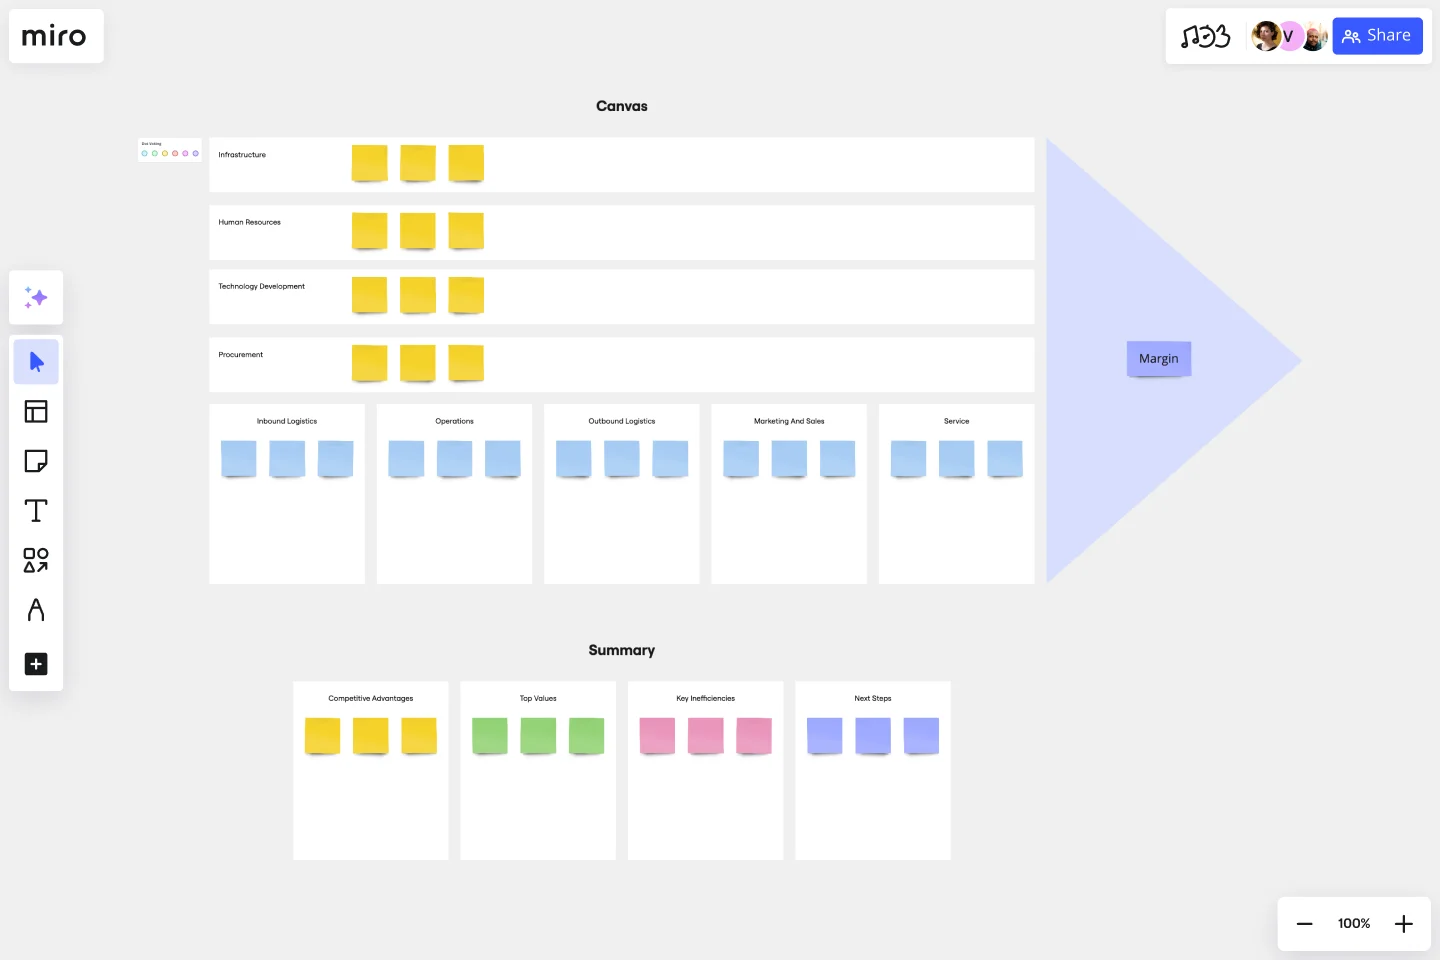
A value chain diagram (also known as a value chain analysis or value stream mapping) is a slightly more complex diagram. It shows every step of a process, focusing on how you and your team can provide value at every step. It’s largely about process improvement, helping you spot bottlenecks and inefficiencies — giving you the information you need to streamline the process.
SIPOC map
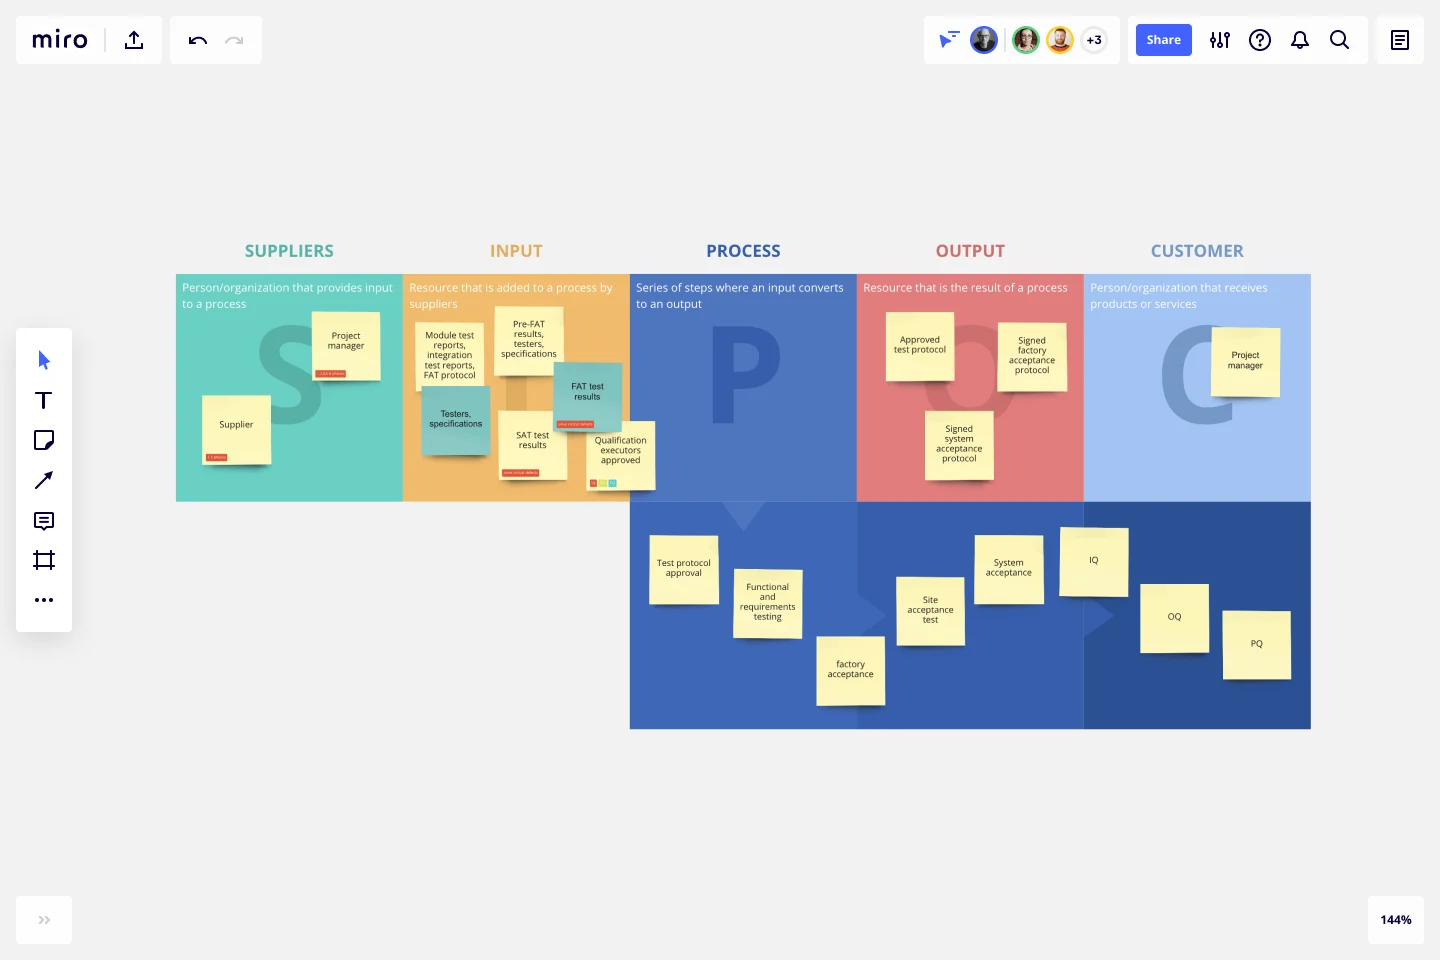
A SIPOC map – which stands for suppliers, inputs, process, outputs, and customer – works through every step of the process, from beginning to end. It starts with who supplies the project's inputs (think things like tools, resources, and knowledge) and ends with who receives the outputs (the final deliverables).
How to create a process map
Now that you know the basics of process mapping, you’re probably eager to get started on your own. Fortunately, it doesn’t need to be an overwhelming experience. With these simple steps, you’ll easily create a successful process map for you and your team:
1. Start with a template
By using Process Map Templates, you can jump straight in and start plotting your processes in a matter of clicks. Customize the existing layout to reflect your own process. Add new columns, sticky notes, or shapes — whatever you need to create an accurate process map and share important context. But whether you’re using a template or building one from scratch, the next few steps are geared to set you up for success:
2. Identify the process
First things first, you’ll need to know what process you’ll be outlining. Are you mapping a sales process? An internal process? The customer journey? Identifying this will make it easier to know what you’re trying to achieve. Not sure what the best processes to map out are? Check in with your team to align on your goal — including why you want to create or improve a certain process.
3. Identify the steps and stakeholders
Next, think about what information you’ll need to plot on your process map. Usually, you’ll find out by answering two questions: what happens and who’s responsible for it.
Let’s say you want to map out your team’s typical process for crafting a blog post — all the way from ideation to publishing. These are probably the steps you’ll need to take, and who’s most likely responsible for each one:
Assign a blog post topic (Content Manager)
Complete SEO research (SEO Specialist)
Draft the blog post (Content Writer)
Review the blog post for SEO (SEO Specialist)
Edit the blog post (Editor)
Create graphics for the blog post (Designer)
Upload and publish the blog post (Content Manager)
Don’t worry about putting tasks in the right order at this stage — your main goal is to outline the steps and stakeholders so that you can plot them on your process map.
4. Plot process activities
It’s time to plot the activities involved throughout the process. Return to your list of steps and stakeholders, and begin mapping out your typical process flow. Remember, you can always adjust your map as you learn new information.
5. Add process map symbols
Now that you’ve got your process in place, it’s time to assign symbols to each stage. That way, you’ll make it easier for both you and your team to identify what each part of the process is without having to write out lots of text. It’s also worth including a key somewhere on your process map to help people understand what each of the symbols means — especially if you came up with your own symbols.
6. Review and iterate
Once you’ve finalized your process map, be sure to review it — ideally together with your team.
As you look over your usual flow, ask yourself questions like:
Are there parts of this process that don’t work the way the map says they should?
Are there bottlenecks and sticking points you frequently run into?
Are there ways you could change or optimize the process?
Are there things that are missing from the process?
It’s also worth using a collaborative process mapping tool so you can easily invite others to view your diagram, tag each other in comments with feedback, and make changes on the go.
Streamline your projects with process mapping
Process mapping is a game-changer when it comes to managing projects across industries. By visually outlining each step of a process, teams can identify inefficiencies, streamline workflows, and ensure everyone is on the same page. Whether you're working in tech, healthcare, or manufacturing, a clear process map helps teams collaborate more effectively, reduce errors, and keep projects on track.
For project managers, process mapping brings clarity. It turns complex workflows into easy-to-follow diagrams, making it easier to allocate resources, set timelines, and communicate with stakeholders. This level of organization not only saves time but also improves overall project outcomes by preventing bottlenecks and identifying opportunities for improvement.
Ready to dive deeper into process mapping and how it can transform your project management? Explore Miro's advanced diagramming capabilities to see how you can bring more clarity and efficiency to your processes.
Author: Miro Team
Last update: October 14, 2025