Organize information with a table chart maker
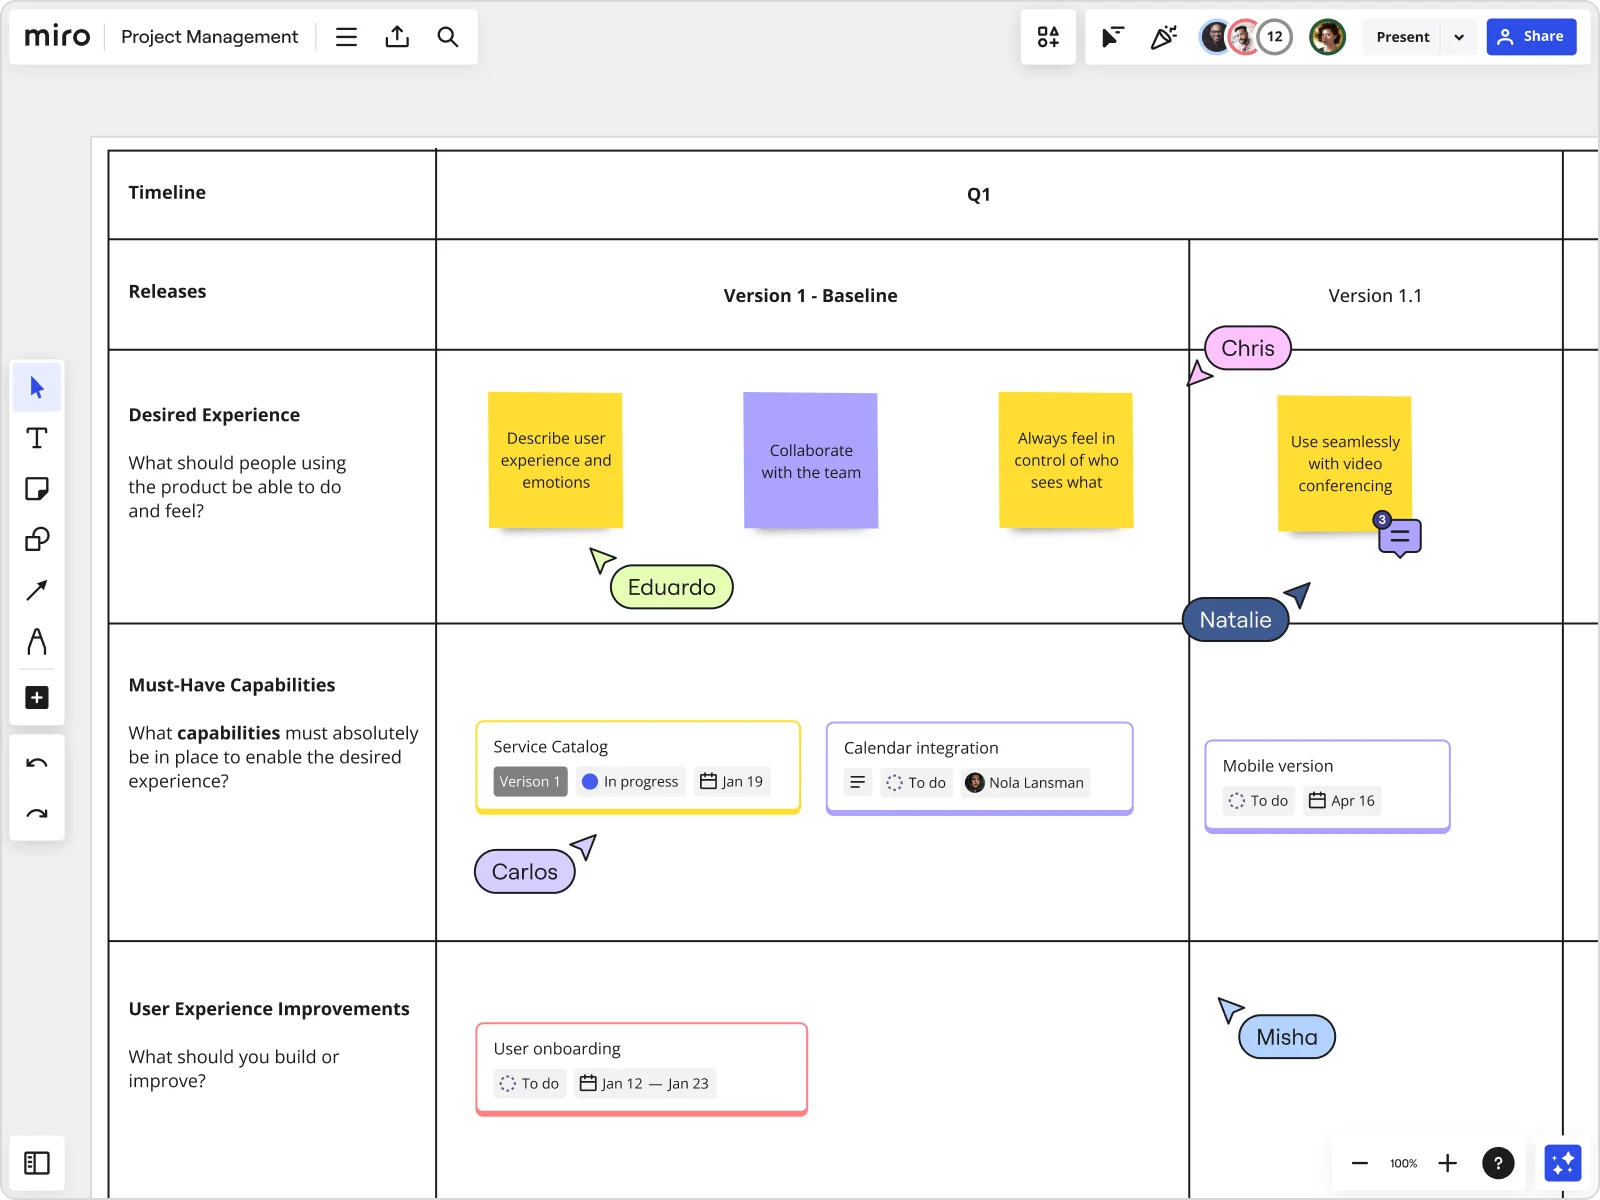
Make a table chart in minutes
Why Miro is perfect for creating a table chart
Automated features
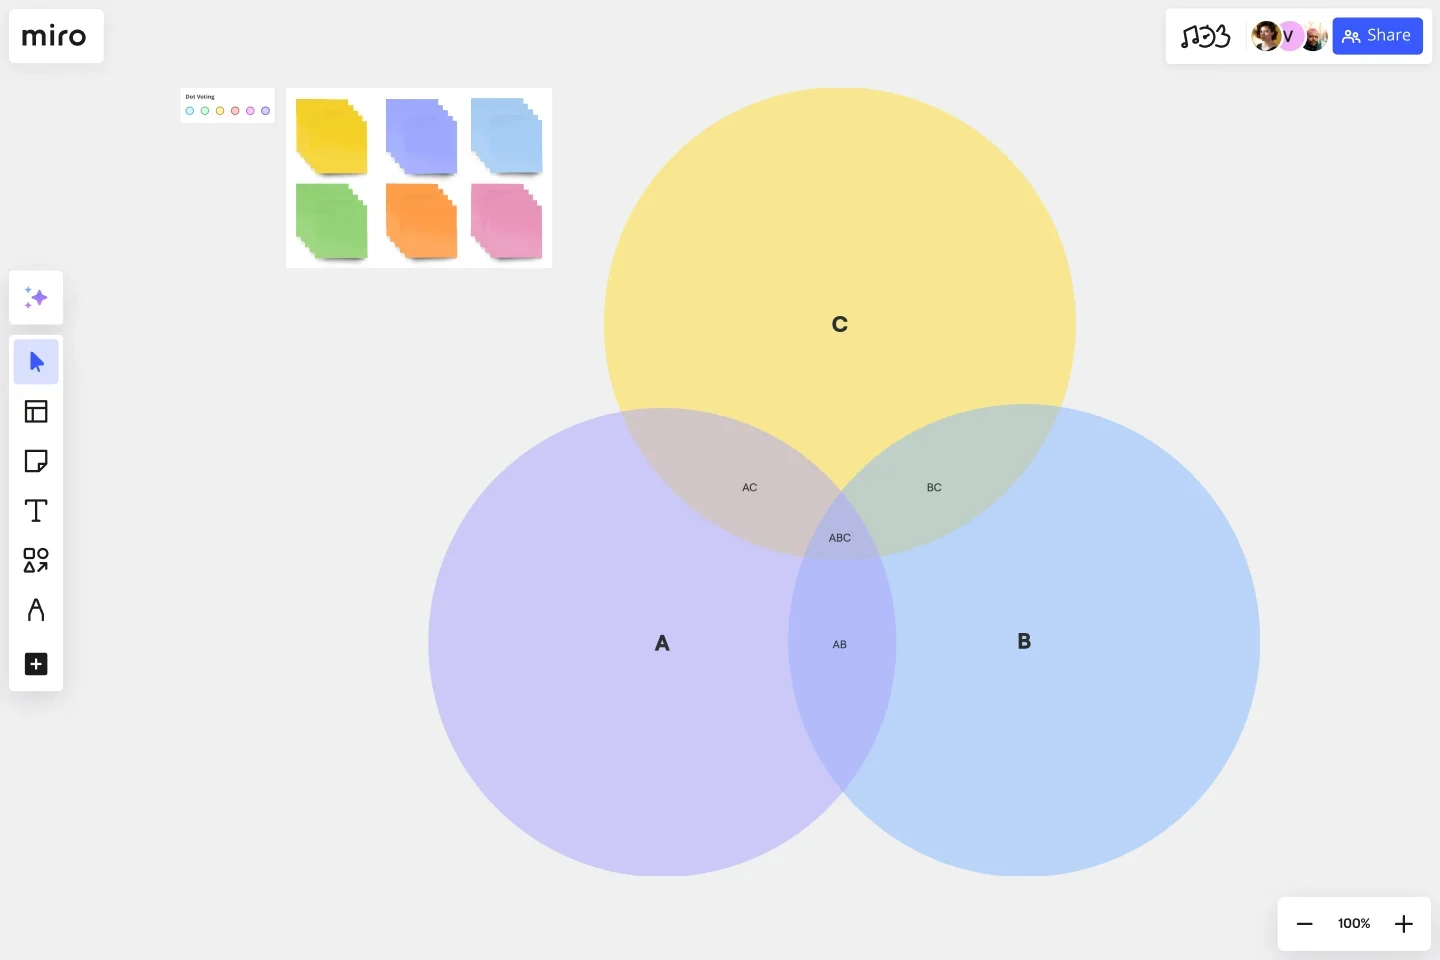
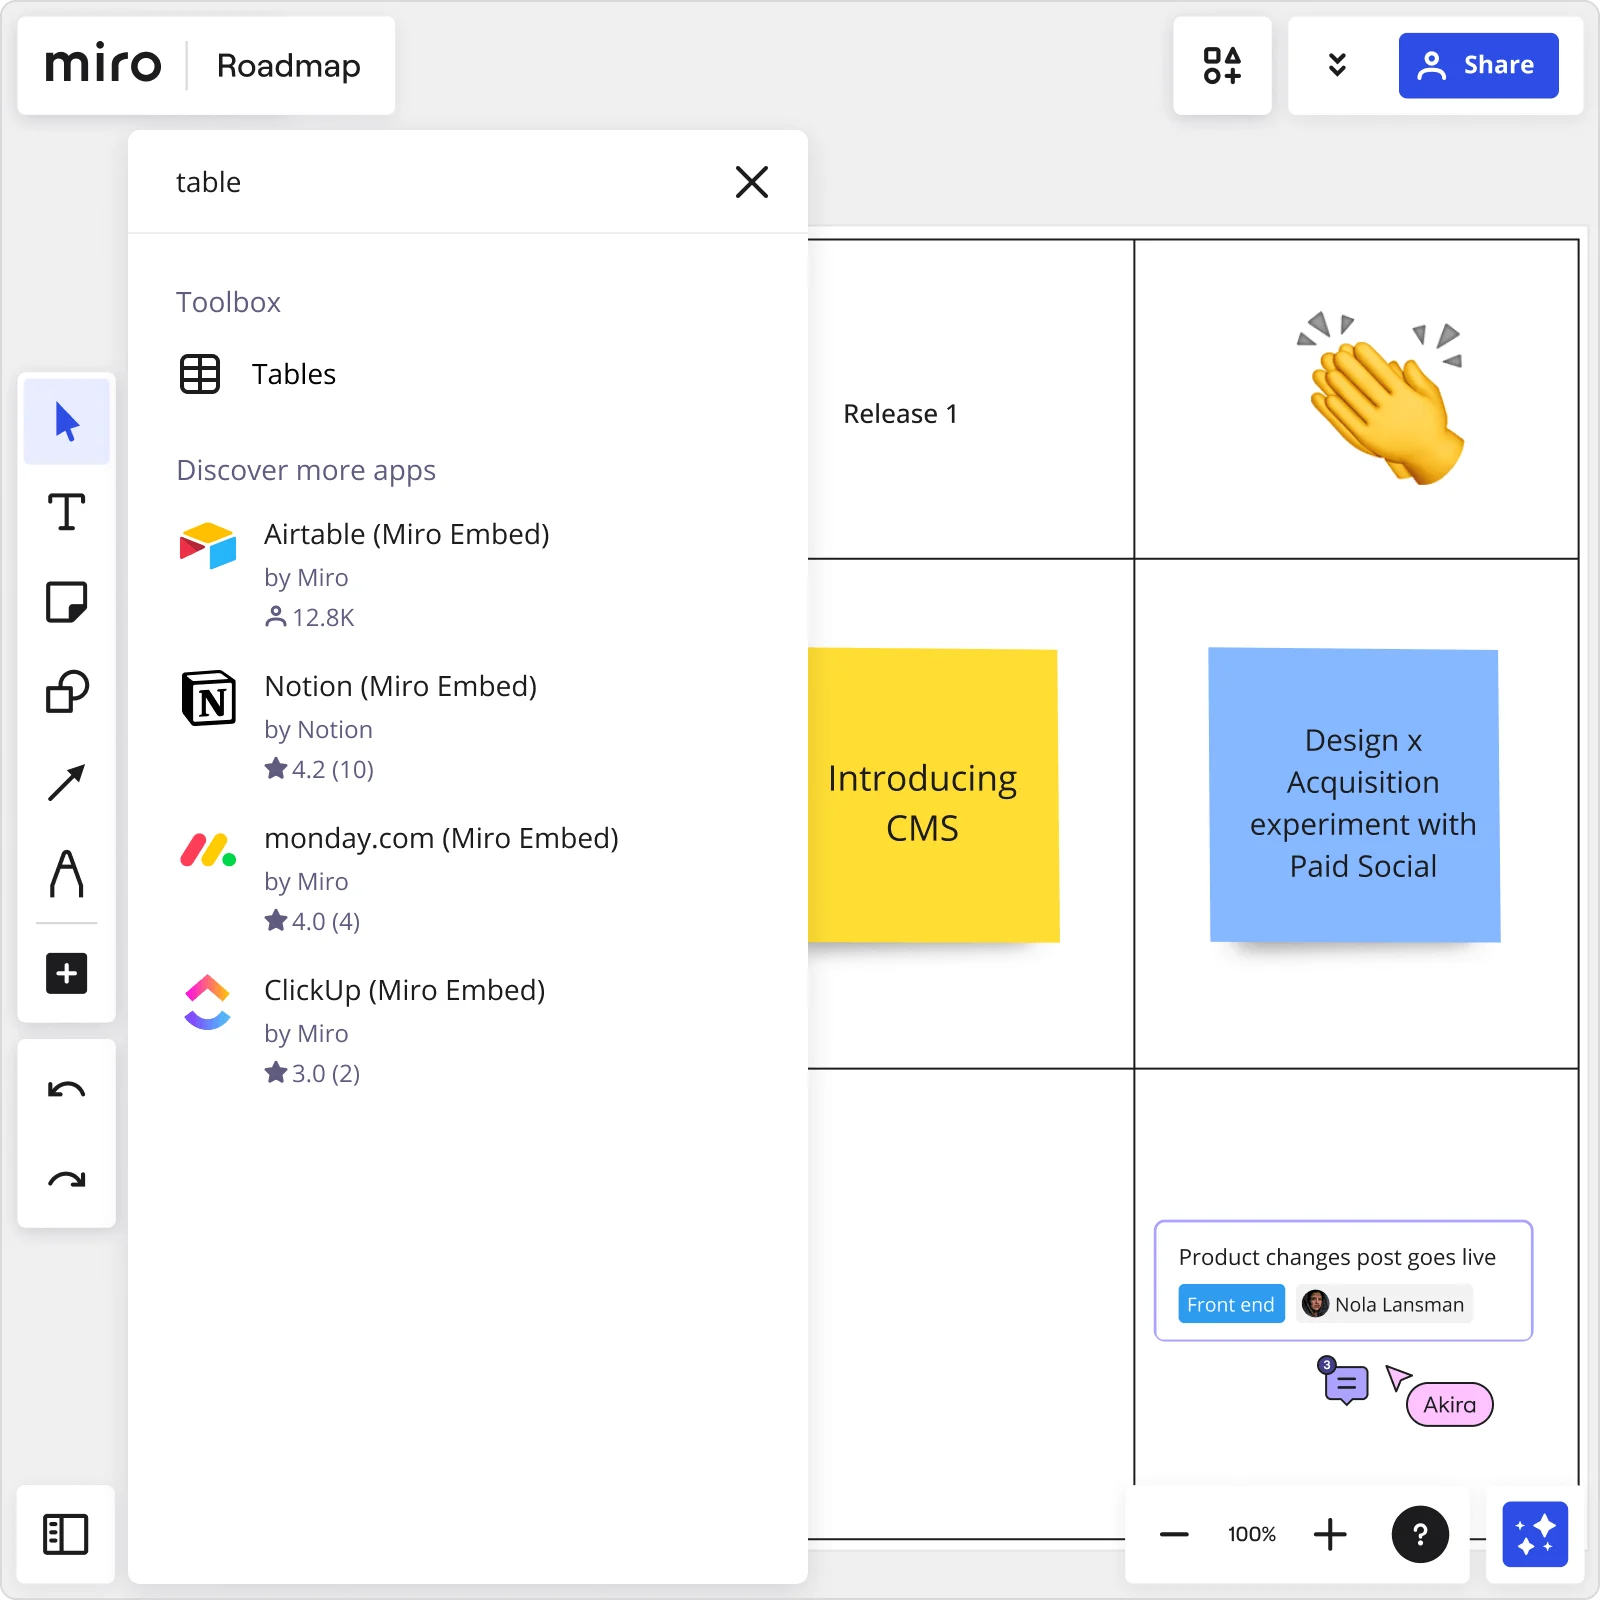
Miro's table chart maker is quick and easy. Add widget icon to your toolbar, and choose how many columns and rows you want your table to have. Drag your table chart to your board and adjust it with just one click.
Easy navigation
Add content to your table chart with sticky notes, shapes, cards, or images. Or double-click your table to add text. With Miro's table chart maker, reduce time organizing information and focus on what matters.
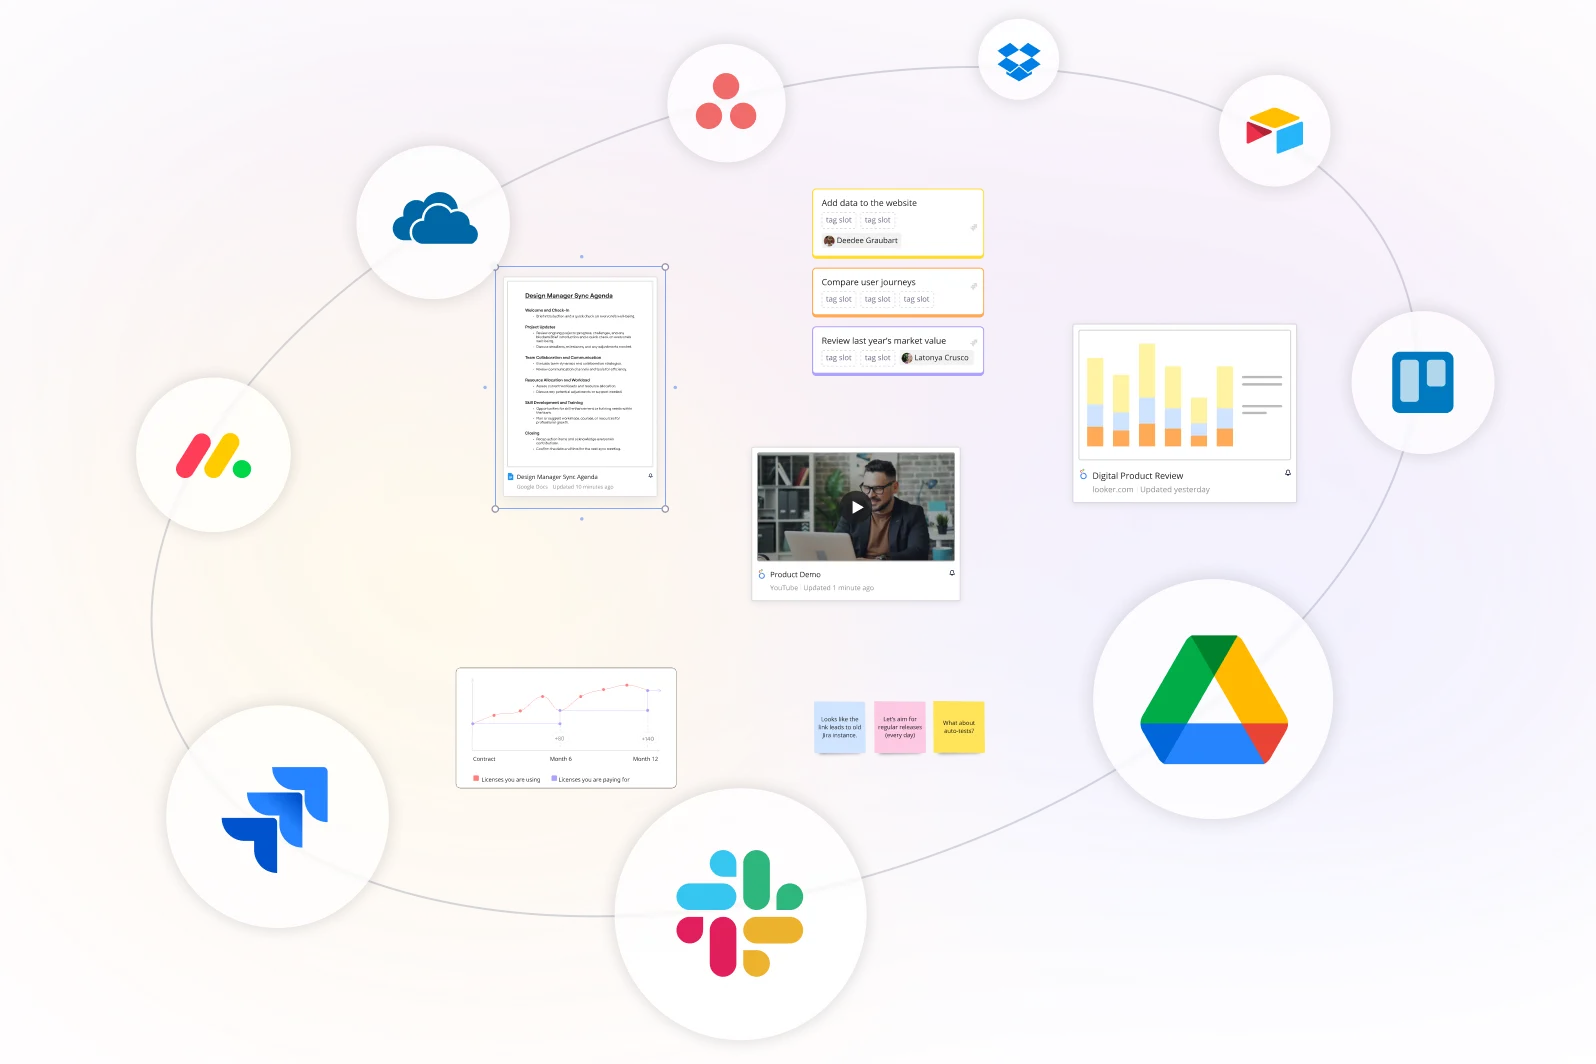
Explore integrations
Instantly sync with Jira, Asana, or Azure. Add the cards to your table chart and keep your regular workflows. Miro's table chart maker allows you to keep everything in one place without switching tools.
Structure ideas in minutes
Miro's table chart maker automatically resizes sticky notes, shapes, cards, or images. Drag it over the table cell, and it will fit the widget. Do you want control over resizing? Turn off “auto-resize” and change grids as you see fit.
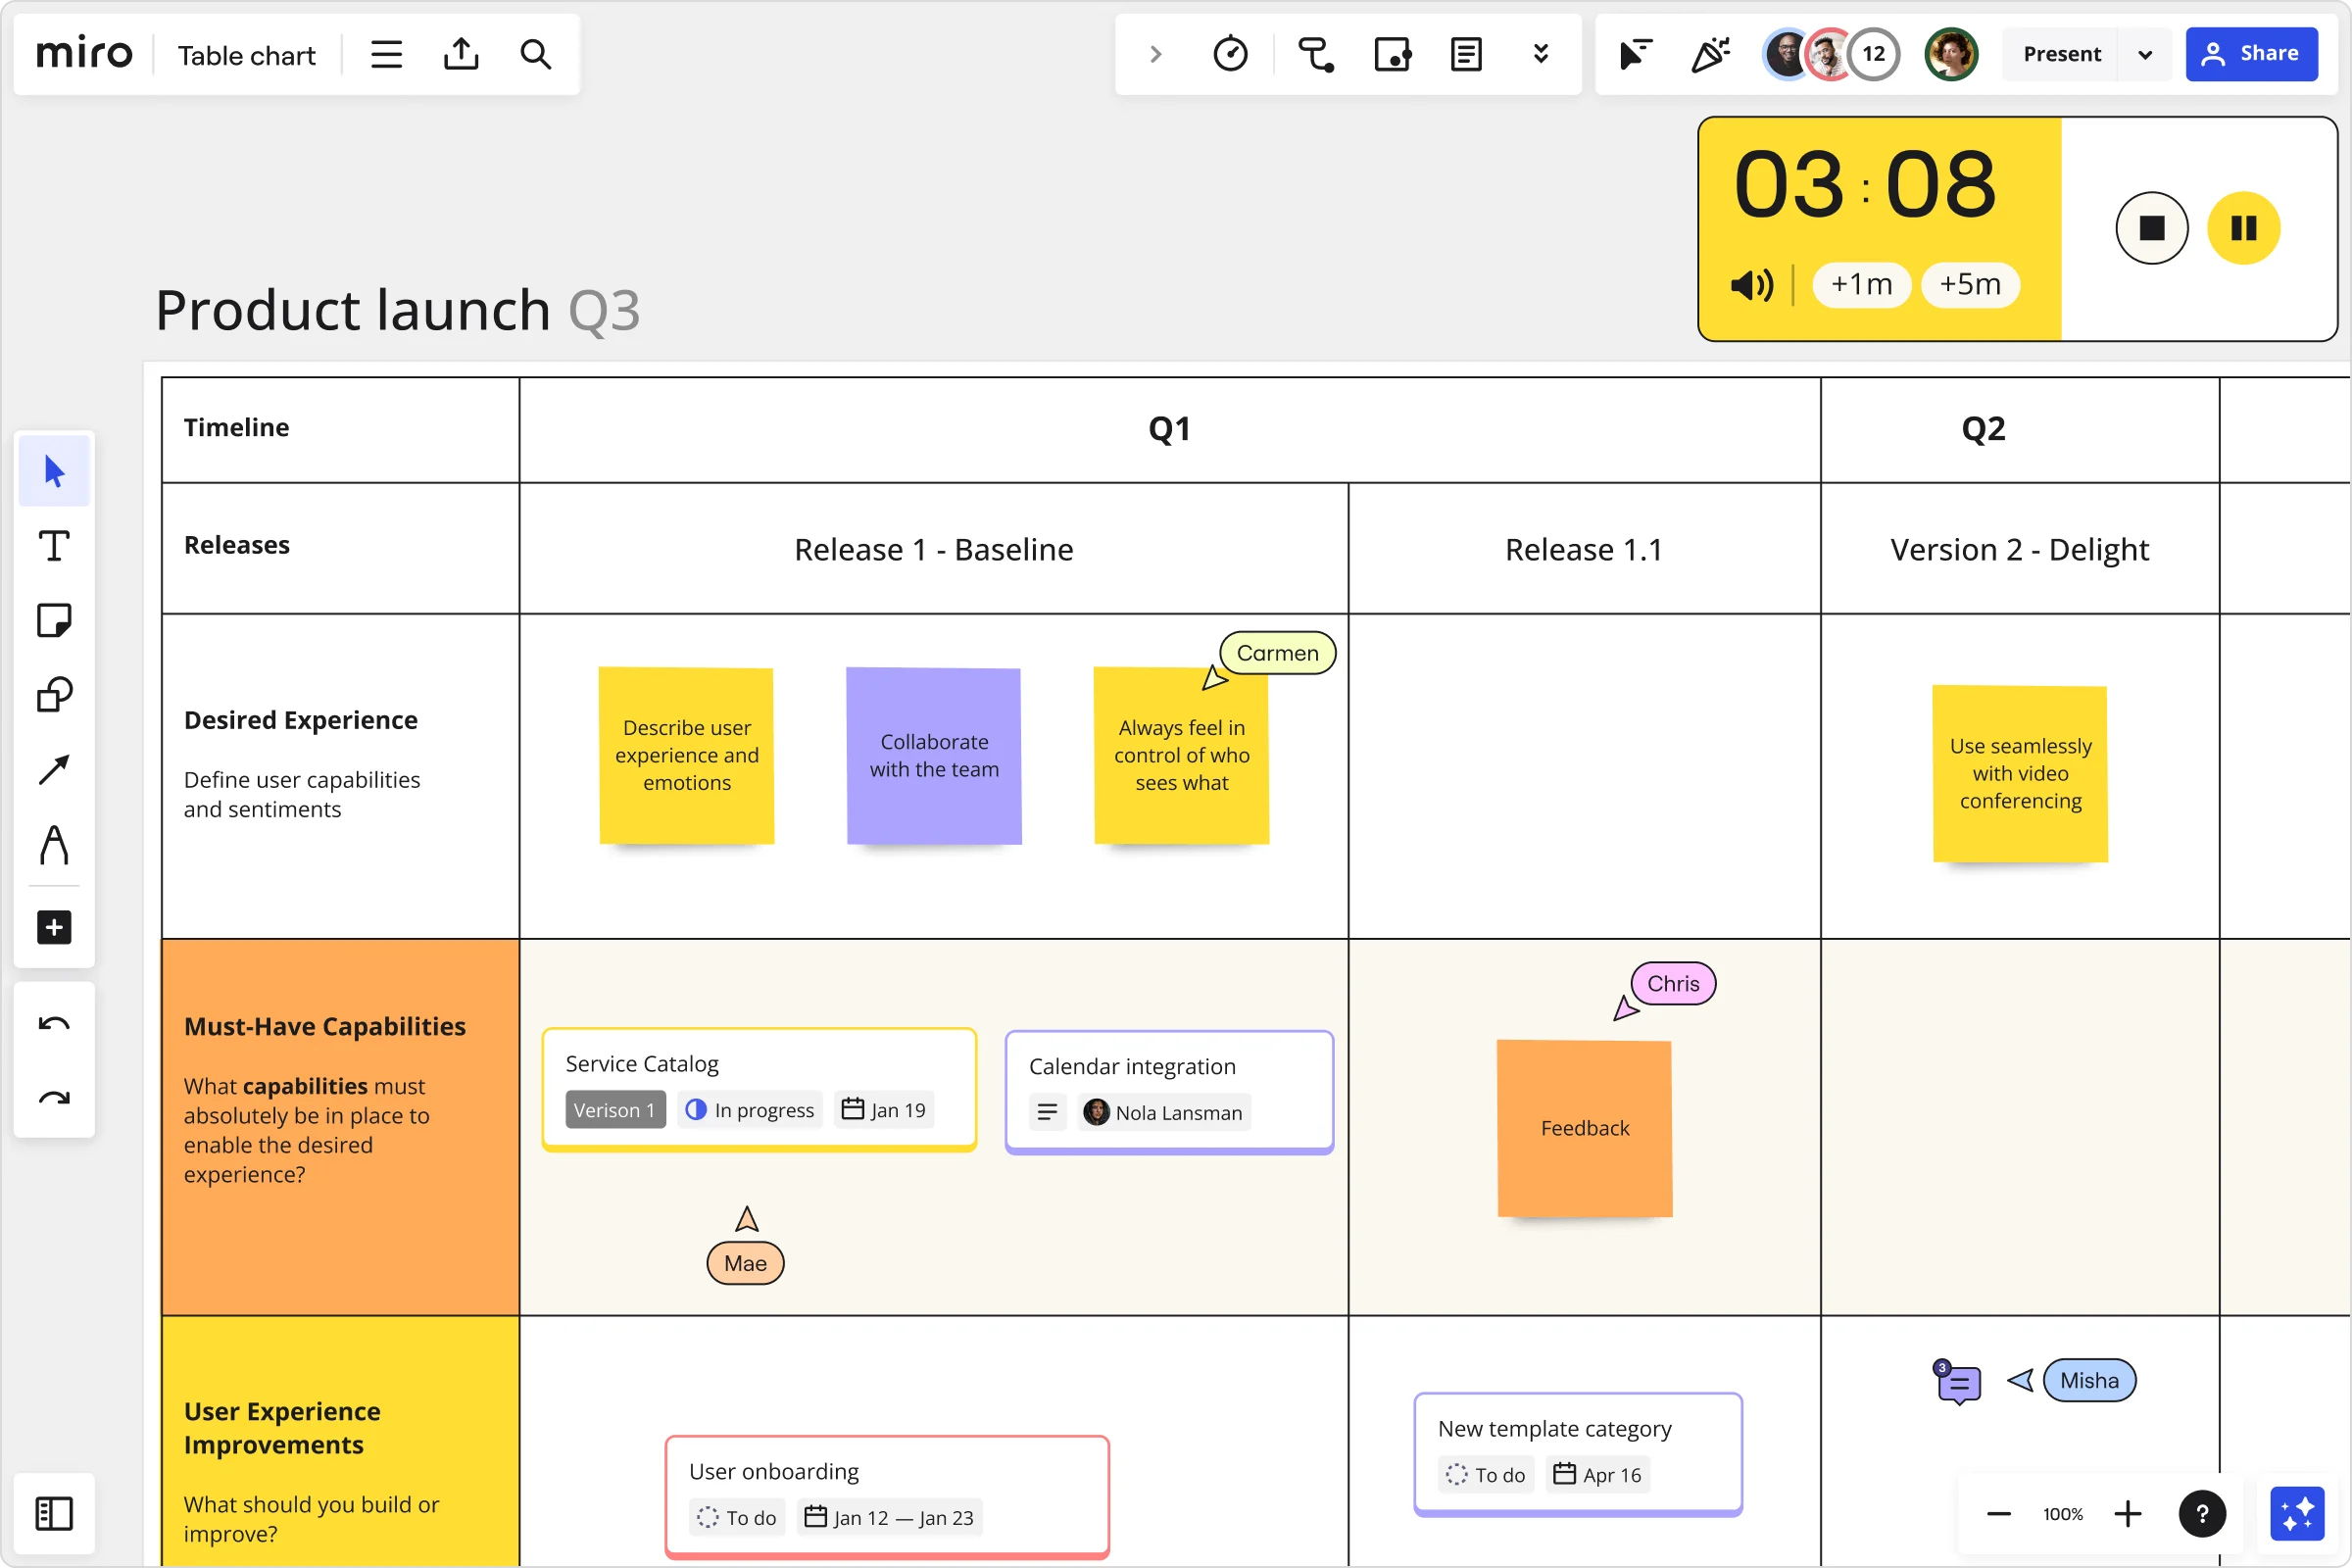
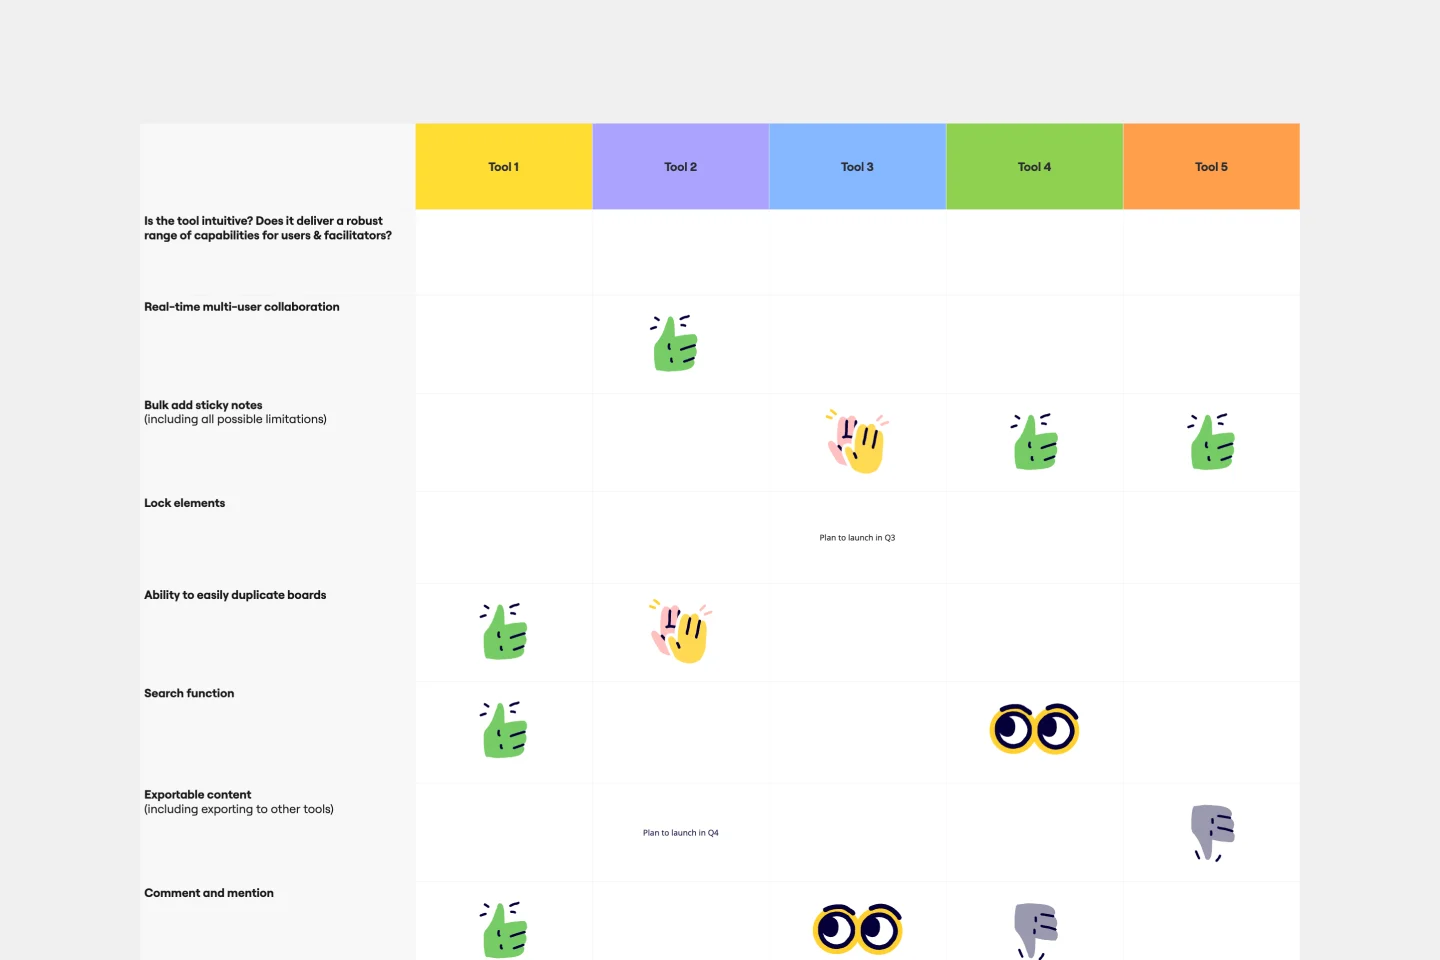
Make clear presentations
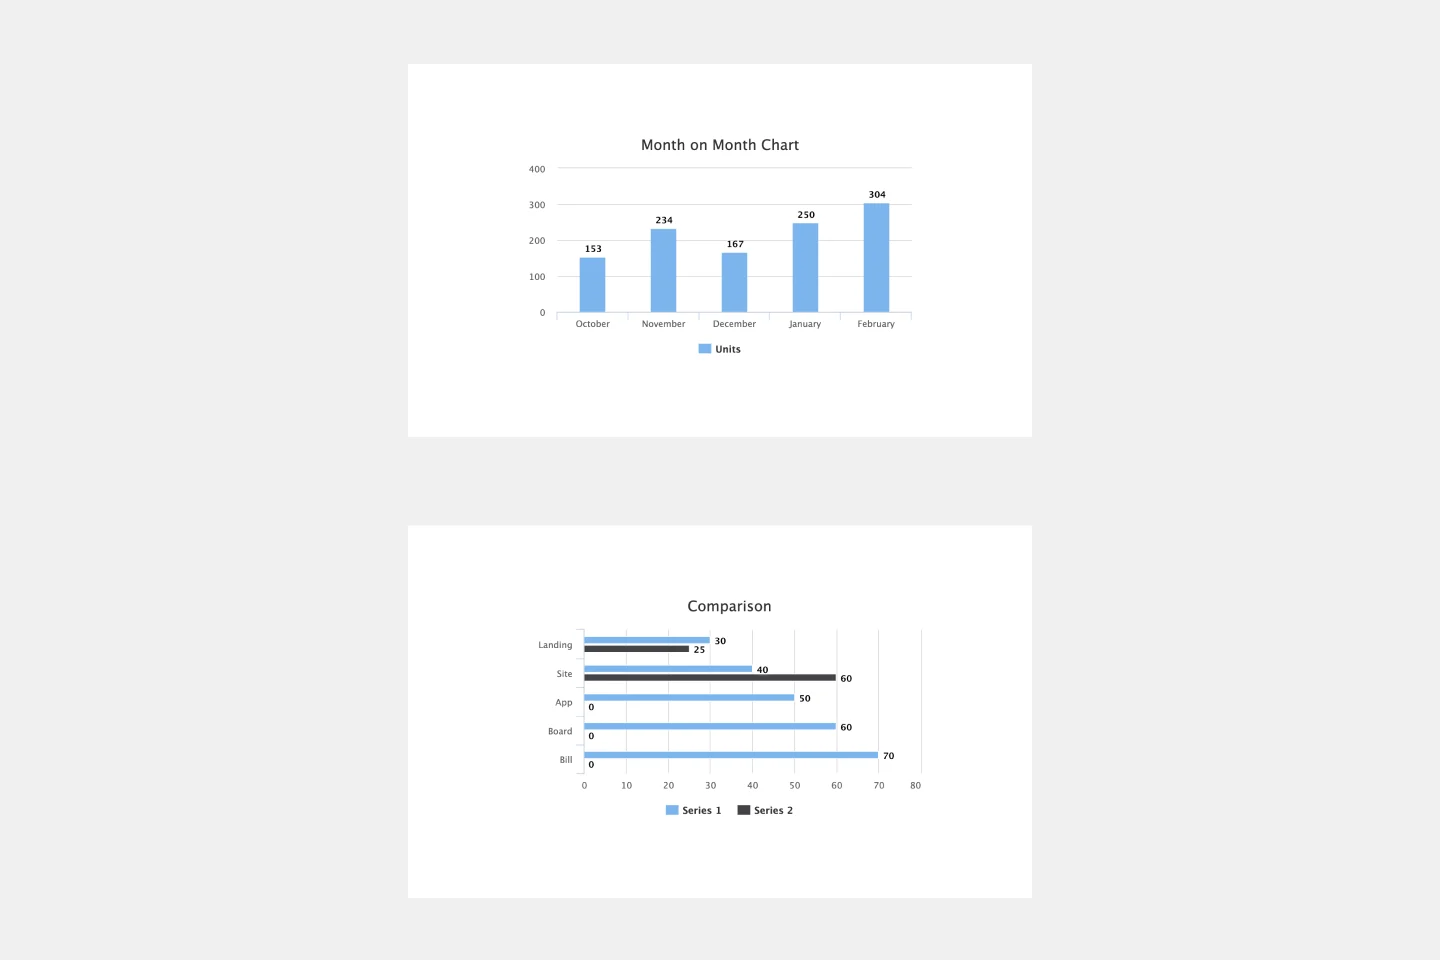
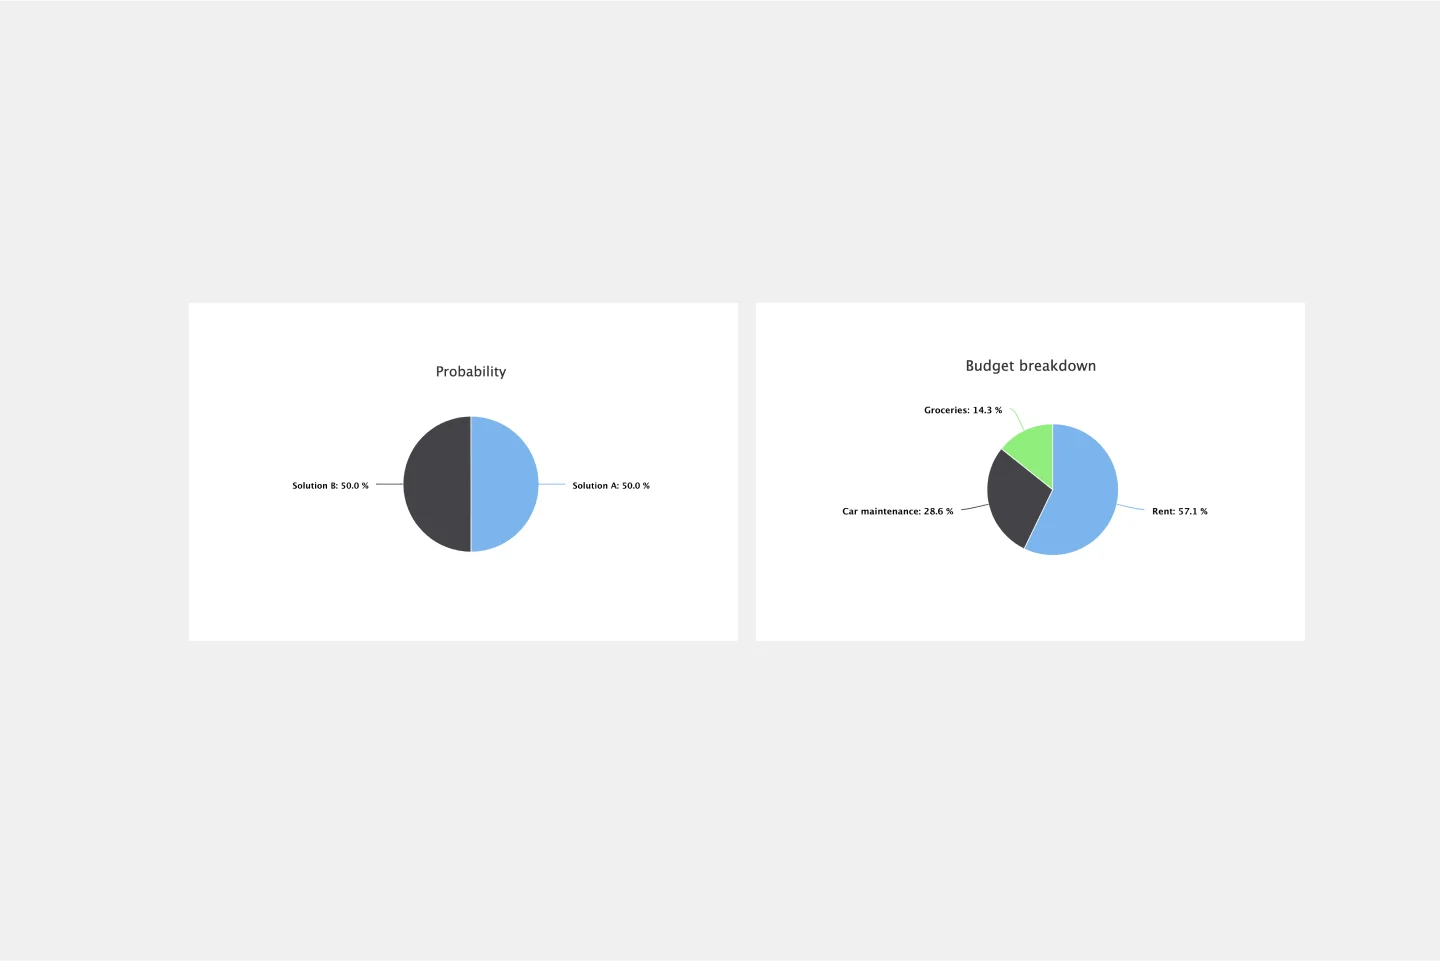
Create table charts to present information visually and bring a common understanding to teams. Let go of many spreadsheets and show data in a way everyone understands.
Simplify work
Create templates for your team and enable everyone to edit and organize information faster. Use Miro's ready-made table templates or create one from scratch using our Tables app.
Integrated with your favorite tools
Related templates
How to create a table chart with Miro

The world's most innovative companies are collaborating in Miro, everyday
“With Miro, we went from project brief to in-market launch in 10 months. That usually takes 3 years at PepsiCo.”
Caroline de Diego
Senior Manager, Global Design & Marketing Innovation at PepsiCo

“Bringing everyone together to plan in Miro means the most impactful initiatives will happen at the right time.”
Lucy Starling
Product Operations Lead at Asos

“The team onboarded in 10 minutes to use Miro for workshops. Getting our organization to adopt this product was a no-brainer.”
Konrad Grzegory
Agile Transformation Lead at CD PROJEKT RED

“Miro templates helped us go from scratch to a full-fledged plan where we mapped activities, ideas, and dependencies.”
Marc Zukerman
Senior Director of Project Management at Hearst

“Miro allows all our teams to align themselves with certain tools and models: they work independently and create products that really meet our customers' needs.”
Luke Pittar
Sustainability Innovation & Design Coach at The Warehouse Group

“To be truly innovative, everyone needs to have a voice, and everyone needs to be able to iterate on each other’s ideas. Miro has made that possible for us.”
Brian Chiccotelli
Learning Experience Designer at HP

Users love Miro for end-to-end innovation. We're the G2 leader in visual collaboration platforms and are rated in the top 50 enterprise tools. Miro helps large companies get meaningful work done.
Top 50 Products for Enterprise
G2 reviews

Table chart maker FAQs
How do you make a table chart?
Making a table chart with Miro is easy. Decide what information you want to include in your chart, and then determine the number of rows and columns. Once you have these elements on your board, you'll be ready to enter the information into your table. Depending on the complexity of your work, you may also want to include titles for the rows and columns and labels for each of the individual cells. When all the information is set, format it according to your needs. This could include things like bolded titles, alternating background colors, or different fonts to emphasize certain elements. Save the table chart as an image or PDF and use it to quickly and easily compare information in the future.
What are table graphs good for?
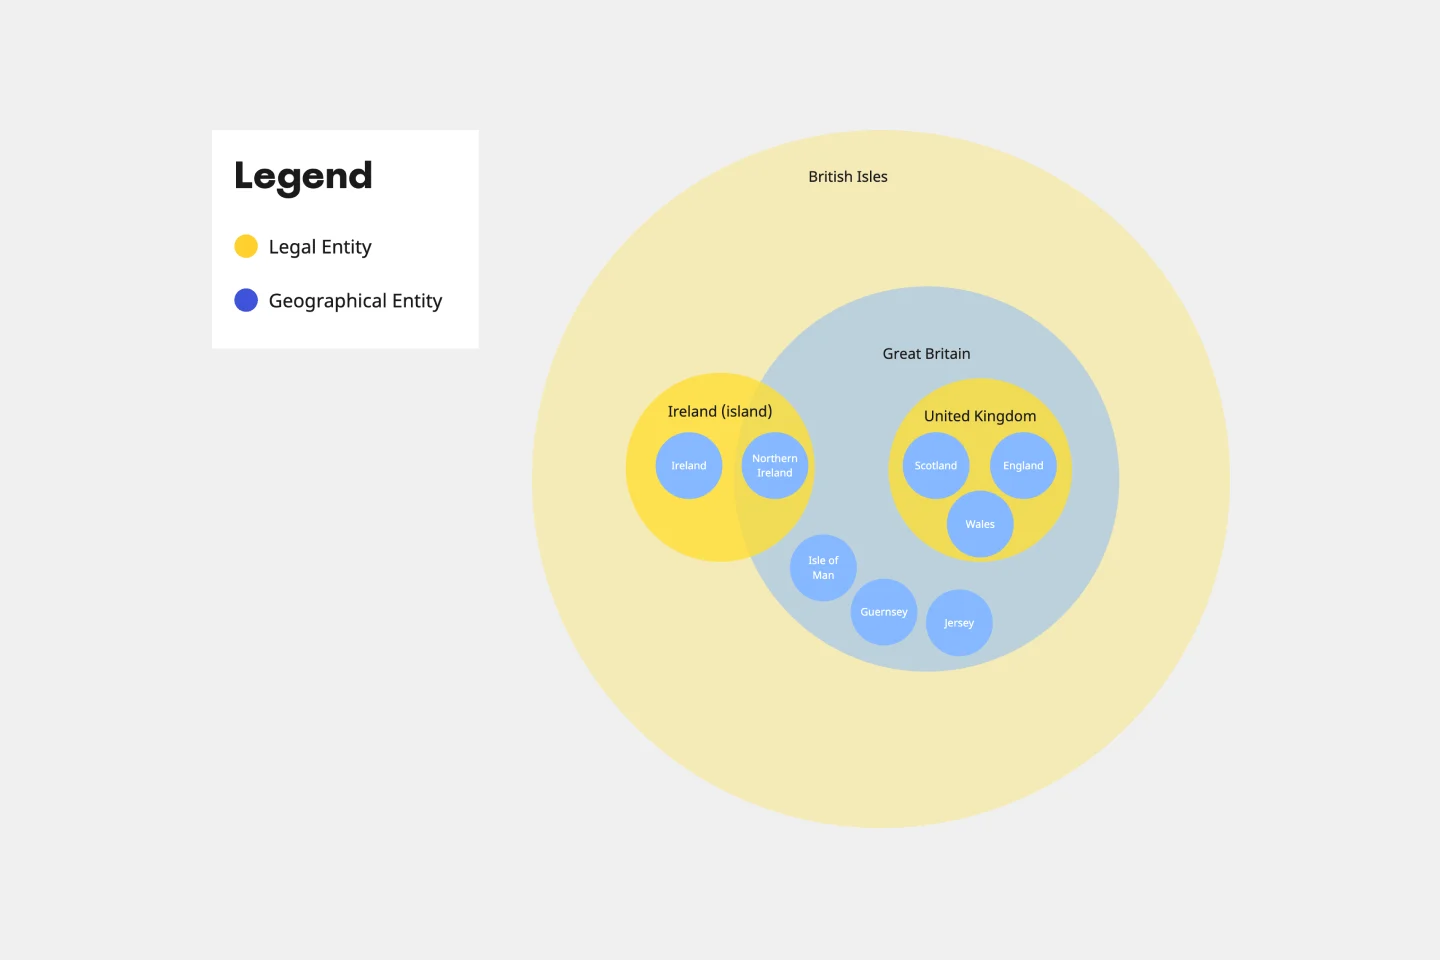
Table graphs help you visualize and understand information. Teams use it to show information in an easy-to-digest format, helping to quickly identify trends and patterns. With table charts, it's easy to spot correlations and compare and contrast info.