Table of contents
Table of contents
How to make a table chart
Unlocking clarity: Crafting table charts in Miro
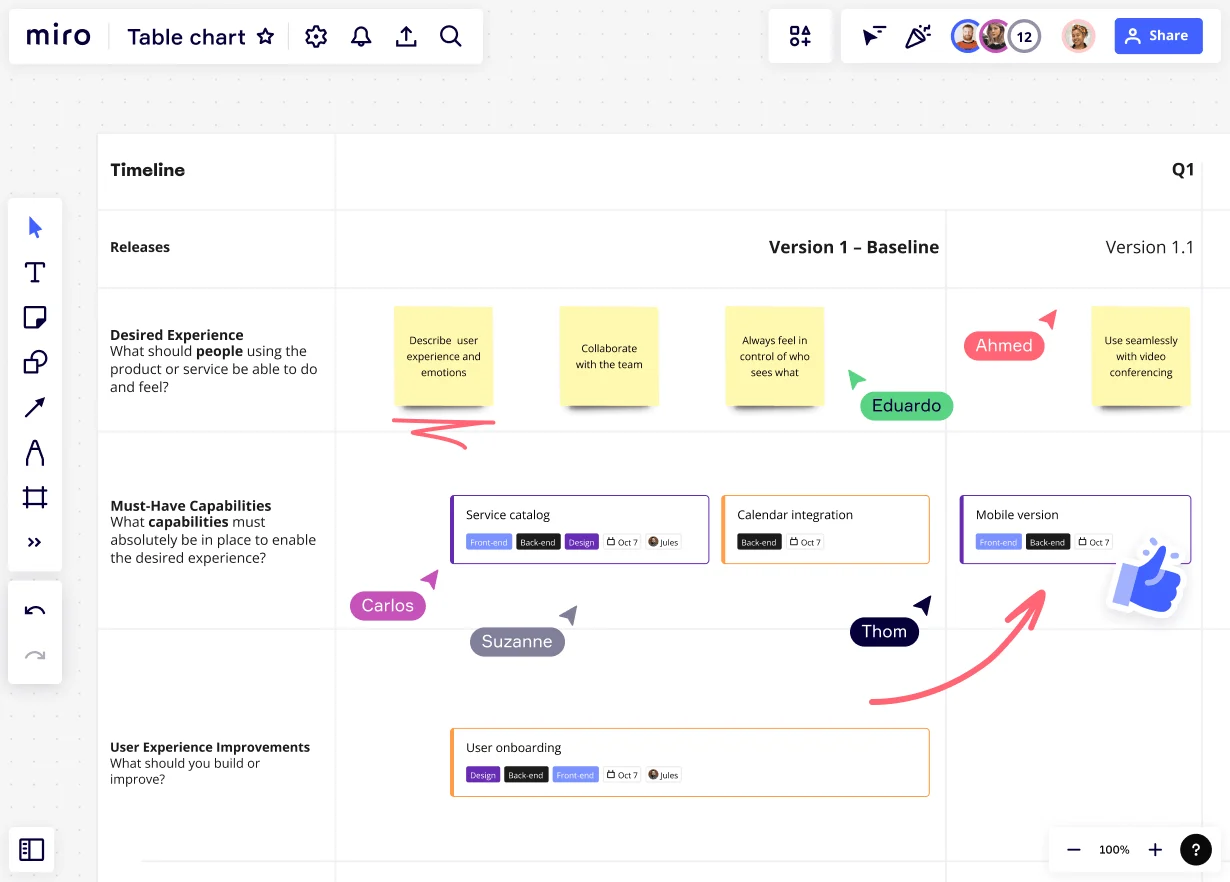
Have you ever considered how organizing your data can transform your work? Table charts are not just tools; they serve as a bridge between raw data and actionable insights. In the dynamic world of product development, quickly visualizing project stages, responsibilities, deadlines, and feedback through table charts is invaluable. These charts enhance understanding and foster a collaborative environment by providing a centralized, accessible, and clear format for all team members.
The role of table charts in team collaboration
Table charts are more than a method of organizing data—they are pivotal in streamlining communication within teams. Here's why they are essential:
Centralized information: Table charts provide a single point of truth for all team members, reducing confusion and miscommunication.
Visual impact: They transform complex data into a visual format that is easier to understand and act upon.
Efficiency: With data neatly arranged, teams can identify trends, draw conclusions, and make decisions more swiftly.
Tracking progress: Particularly useful for product teams, table charts keep track of development stages, responsibilities, and deadlines.
Step-by-step guide: Creating table charts in Miro
Creating a table chart in Miro is straightforward, yet detailed attention to each step can significantly enhance the outcome:
1. Open a new board
Navigate to your Miro dashboard, click on the "+ Create" button, and select "New board" to start with a clean workspace.
2. Access the table tool
On the toolbar, find the table icon, which might be grouped under "Frameworks" or similar categories, depending on your toolbar customization.
3. Initiate your table
Click on the table icon, then click and drag on the board to define where your table starts and ends. This action creates a grid that will become your table.
4. Adjust dimensions
After drawing the initial table, hover over the table borders and drag to increase or decrease the number of rows and columns according to the data requirements of your project.
5. Customize initial settings
Right-click on the table to access settings such as "Lock" (to prevent accidental edits), "Properties" (to adjust grid lines or header backgrounds), and "Copy/Paste" functionality.
Customizing your table chart
Once the basic structure of your table is set up, enhancing its functionality and aesthetics can make the data more accessible and engaging:
1. Adjust cell sizes
Hover over the border of any cell, then click and drag to resize. Larger cells might be used for more significant data points, or to accommodate images.
2. Apply colors
Click on a cell or select multiple cells, then choose a fill color from the toolbar. Use color coding consistently—for example, different shades to indicate task status (e.g., green for complete, yellow for in progress, red for delayed).
3. Insert icons or images
Enhance cells by adding icons or images that correspond to the data. Click the "+" icon in the toolbar, select "Uploads" and drag your chosen image into the cell.
4. Format text
Select the text within cells to adjust font size, style, and alignment from the text editing toolbar, making key data stand out or ensuring consistency across the table.
5. Link to external resources
Make your table interactive by linking cells to external documents or other Miro boards. Click on a cell, then choose the link option from the context menu to add a URL.
Principles of effective table chart design
A well-designed table chart is both appealing and functional. Keep these principles in mind:
Simplicity: Avoid clutter. Only include the necessary information to maintain focus.
Consistency: Use consistent colors and fonts to facilitate quick understanding.
Alignment: Properly align text and numbers for a clean, professional look.
Legibility: Ensure text size and contrast are sufficient for readability.
Common mistakes and how to avoid them
When it comes to creating table charts, a few common pitfalls can hinder their effectiveness. To avoid these issues, we've compiled some tips.
Overloading with data: Avoid cramming too much information into a single table. If the data feels overwhelming, consider splitting it into multiple charts or using filters to manage visibility.
Neglecting headers: Use clear, descriptive headers for each column. This helps prevent confusion and ensures that users can easily understand the data presented.
Ignoring mobile users: Given the increasing use of mobile devices, ensure your table charts are responsive and legible on smaller screens. This may require simplifying the data or adjusting the layout for mobile viewing.
Inconsistent design: Maintain consistency in your use of colors, fonts, and formatting rules. This helps make the table aesthetically pleasing and aids in data interpretation and user navigation.
Empowering everyone to create table charts
Creating and customizing table charts in Miro is designed to be intuitive and user-friendly, making it easy for anyone to do it. Whether you're a seasoned data analyst or new to data visualization, Miro provides all the tools and support to create visually appealing and effective table charts. The ease of use and powerful collaboration features make Miro an ideal choice for teams looking to enhance their project management and data presentation capabilities. Creating table charts in Miro is more than just organizing data; it's about empowering teams to communicate more effectively and move projects forward with confidence.