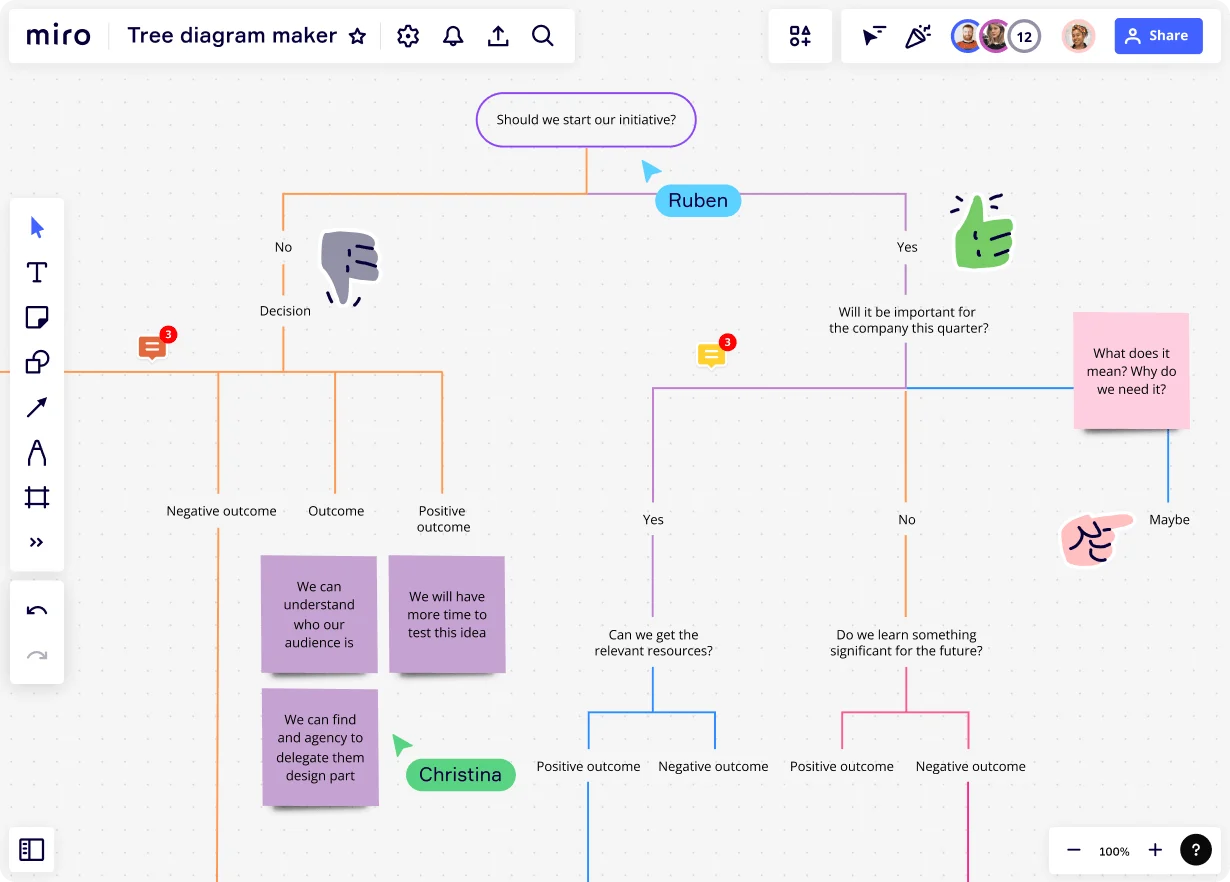
What is a tree diagram?

Summary
In this guide, you will learn:
What a tree diagram is: its components (nodes, branches) and hierarchical structure
How to identify its purpose, main nodes, and sub-nodes for data/decision representation
The step-by-step creation process: defining root, connecting, and labeling nodes
How to use Miro’s tree diagram maker and templates for quick building and customization
Features of Miro’s tool: infinite canvas, automated diagramming, and collaboration
Ways to effectively present, share, and export your diagrams for decision-making and idea organization
Try Miro now
Join thousands of teams using Miro to do their best work yet.
A tree diagram is a graphical representation used to display data that follows a hierarchical model. Originating from the likeness of a tree, it uses branches to represent the subdivision of activities or processes.
In both academic and professional settings, visual aids like tree diagrams simplify intricate topics, making it easier for stakeholders to understand and engage with the content.
Key Components of a Tree Diagram
Understanding the fundamental elements of a tree diagram can provide clearer insights into its construction and interpretation. These are the components of a tree diagram:
Nodes and Branches
At the core of a tree diagram are nodes, which symbolize data points, events, or decisions. Branches connect these nodes, illustrating the relationships or flows between them.
Hierarchical Structure
The tree diagram's hierarchical model is paramount, with each branch stemming from a node, representing subdivisions or successive steps in the process.
Types of Tree Diagrams
Tree diagrams come in various forms, each tailored to a specific application or field. The most commonly used ones include:
Genealogical Trees
Often used in biology and genealogy, these charts trace lineage and genetic connections, presenting a clear visual of familial relationships and generational progressions.
Decision Trees
Widely adopted in business analytics and decision sciences, a decision tree maker helps you visualize potential outcomes and decisions, allowing analysts to anticipate risks and opportunities.
Fault Trees
Primarily used in engineering and safety analysis, these trees identify and analyze potential system failures, enabling preemptive action.
Organizational Trees
In the corporate sector, is common to use an organizational chart maker to illustrate the organizational structure, detailing roles, hierarchies, and team dynamics.
Practical Applications of Tree Diagrams
From the classroom to the boardroom, tree diagrams find utility across diverse domains.
Business and Management
Tree diagrams play a pivotal role in project planning, strategy formulation, and risk analysis, providing managers with a comprehensive view of potential challenges and solutions.
Science and Research
Researchers often deploy tree diagrams to categorize data, identify patterns, and visualize complex research constructs, ensuring clarity in analysis.
Education and Learning
Educators utilize tree diagrams to break down syllabi, explain concepts, and engage students with visual learning tools.
How to Make a Tree Diagram
Creating an effective tree diagram involves understanding its purpose, target audience, and the data it seeks to represent.
Step 1: Identify the Purpose
Begin with a clear understanding of what you want the tree diagram to depict.
Step 2: Determine the Main Nodes
Establish the primary data points or decisions.
Step 3: Develop Sub-Nodes
Enumerate possible outcomes or subdivisions.
Step 4: Review and Refine
Iteratively optimize the diagram for clarity and relevance.
Check also our guide on how to draw a tree diagram to learn more.
Essential Tools
Modern software solutions have made the creation of tree diagrams more efficient, interactive, and precise. For instance, Miro's tree diagram maker is easy-to-use and allows you to collaborate on your tree diagram in person or remotely, synchronously or async. Your tree diagram can be continually updated and become the single source of truth.
Best Practices
For tree diagrams to be effective, certain universally accepted guidelines and best practices should be followed.
Maintain Consistency: Standardize symbols, colors, and labels across the diagram.
Prioritize Clarity: Ensure the diagram is easy to interpret, even for those unfamiliar with the topic.
Consider Your Audience: Adapt the complexity and depth of the diagram based on the intended audience.
Conclusion
Tree diagrams are indispensable tools in numerous fields, offering clarity, facilitating decision-making, and providing an organized visual of complex data. Their adaptability ensures their continued relevance and utility in diverse scenarios.
Author: Miro Team
Last update: October 9, 2025