
Table of contents
Table of contents
11 types of diagrams and how to choose the best one for your project

Summary
In this guide, you will learn:
11 common diagram types and uses (flowcharts, network, ER, UML, block, etc.).
How ER diagrams organize database structures.
UML diagrams model software systems.
Block diagrams give high-level system overviews.
Miro's tools and AI facilitate diagram creation.
Choose the right diagram for effective communication.
Try Miro now
Join thousands of teams using Miro to do their best work yet.
Types of diagrams and their uses
Diagrams are more than just pretty visuals—they're a powerful way to communicate complex ideas clearly. Whether you're sketching out a product flow, defining a process, or just trying to get a bird's-eye view of your project, choosing the right type of diagram can make all the difference.
With so many different types of diagrams out there, knowing which to use isn't always straightforward. In this comprehensive guide, we will provide you with an in-depth overview of different types of diagrams, highlighting their features, applications, and benefits.
Flowcharts: Mapping processes and workflows
Flowcharts are widely recognized as valuable tools for visualizing and understanding processes or workflows. Using standardized symbols and connectors, flowcharts provide a clear and logical representation of sequential steps and decision points. They help identify bottlenecks, streamline operations, and improve overall efficiency.
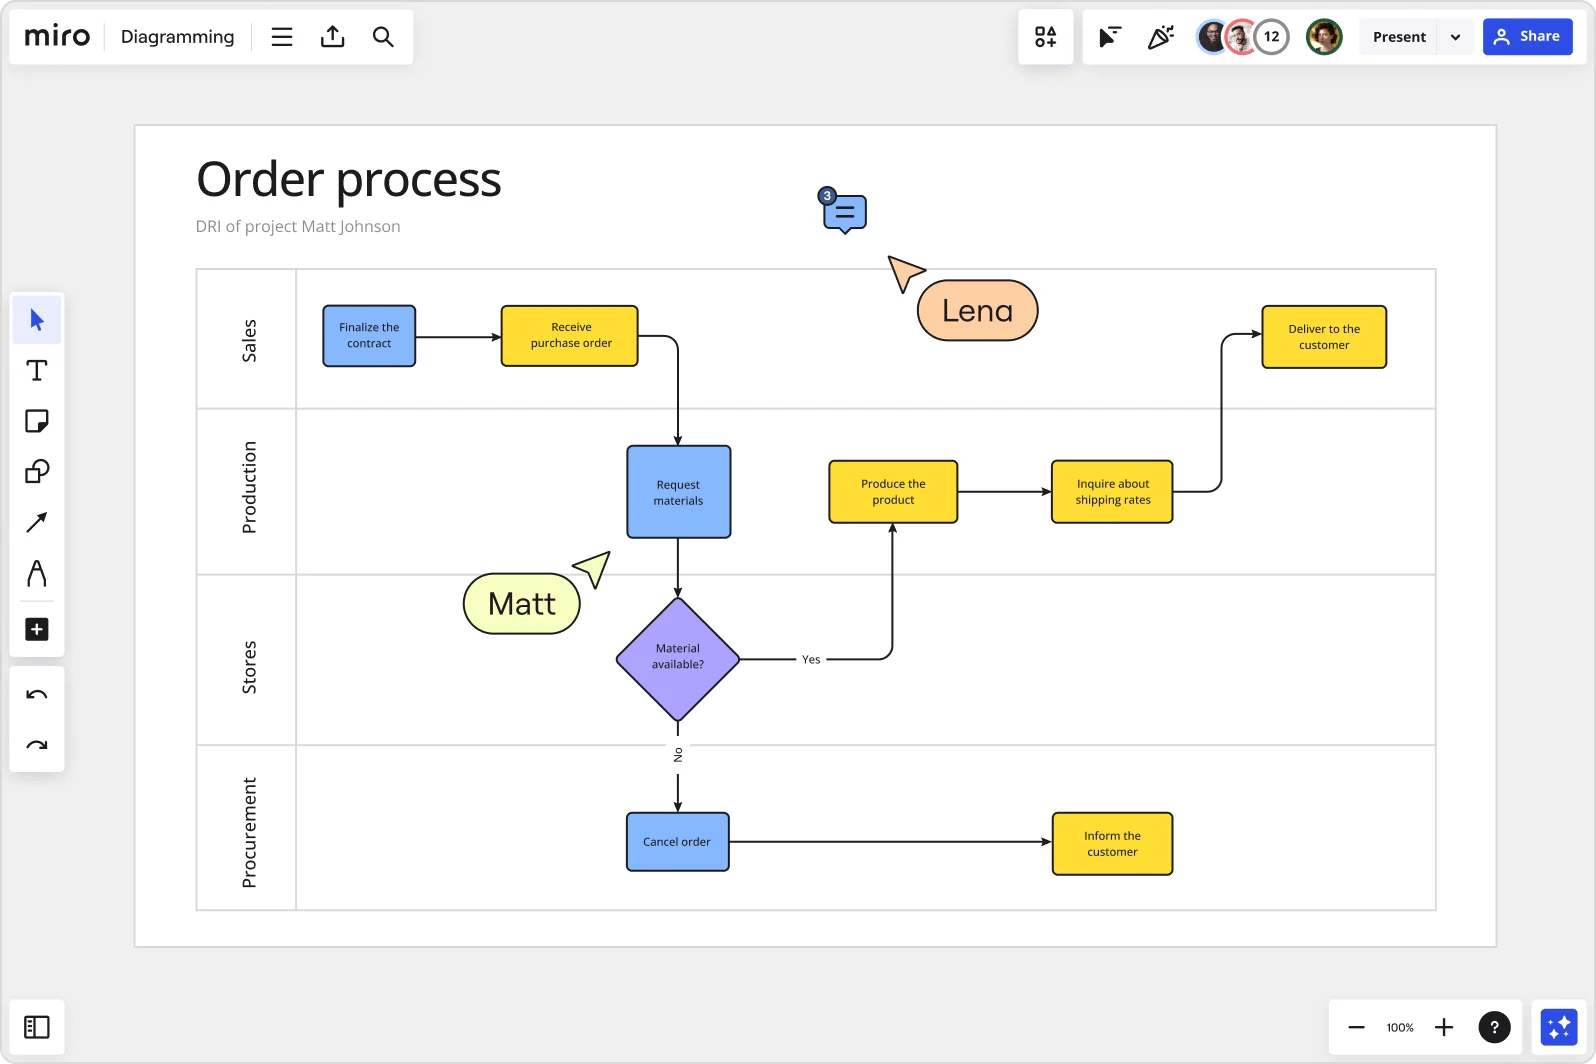
Flowcharts are particularly useful in programming, decision-making, and project management. Creating a flowchart allows you to visually depict the sequence of steps in a process — eliminating guesswork and uncertainty.
Network diagrams: Visualizing relationships and connections
Network diagrams are used to represent networks of communication, data flow, or connections between different entities. By using nodes and edges, they showcase the interdependencies and interactions within a network infrastructure or system. They are commonly employed in fields such as computer networking, telecommunications, and system analysis.

Deciding how to make a network diagram depends on the type of network being visualized. Miro offers a range of ready-made templates like AWS, Cisco, and Kubernetes, to simplify the process. If you'd prefer to create your online network diagram from scratch, Miro's diagramming tool has an extensive range of shape packs and icons.
ER diagrams: Designing database structures
ER diagrams visually represent entities, relationships, and attributes, providing a blueprint for organizing and structuring databases. They are widely used in industries such as software development, data management, and business analysis.
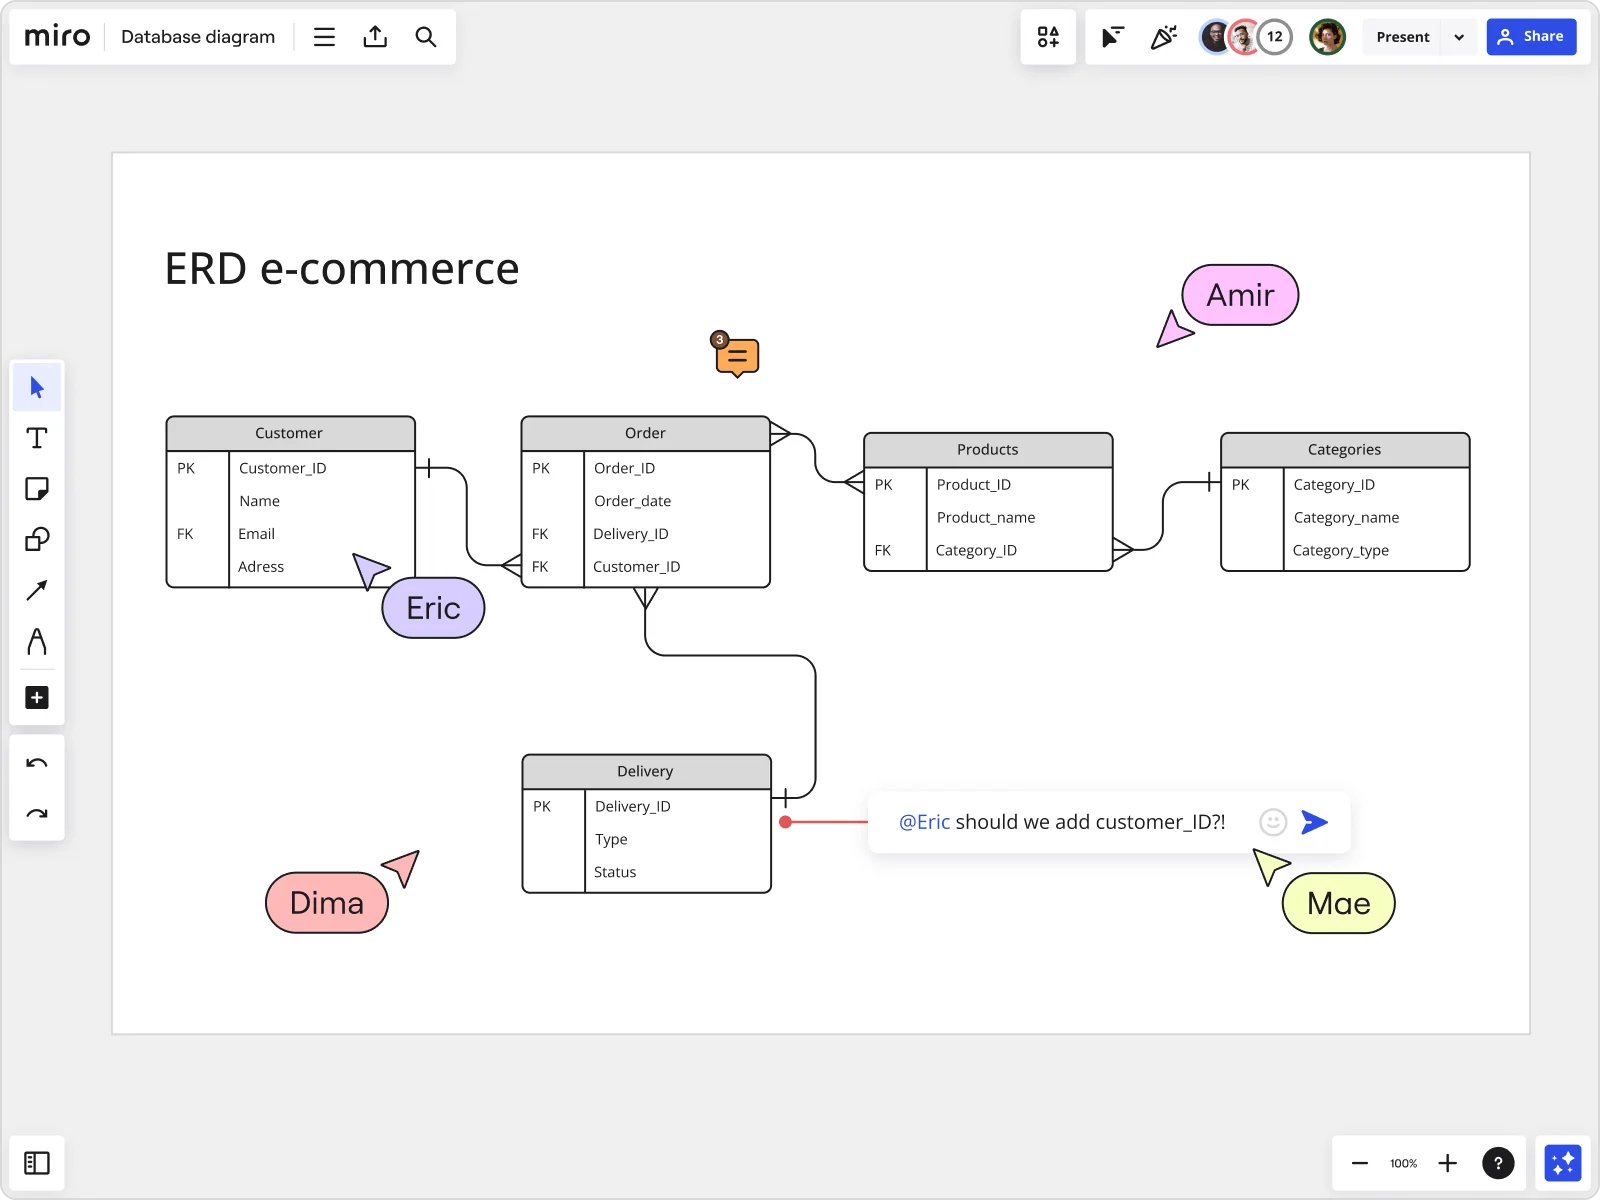
Visualizing a database is no easy feat, but Miro's ER diagram tool offers an intuitive interface and a wide range of features to streamline the database design process.
UML diagrams: Modeling software systems
UML (Unified Modeling Language) diagrams represent various aspects of software systems, including structure, behavior, and interactions. They are widely utilized in software engineering, system architecture, and application development.
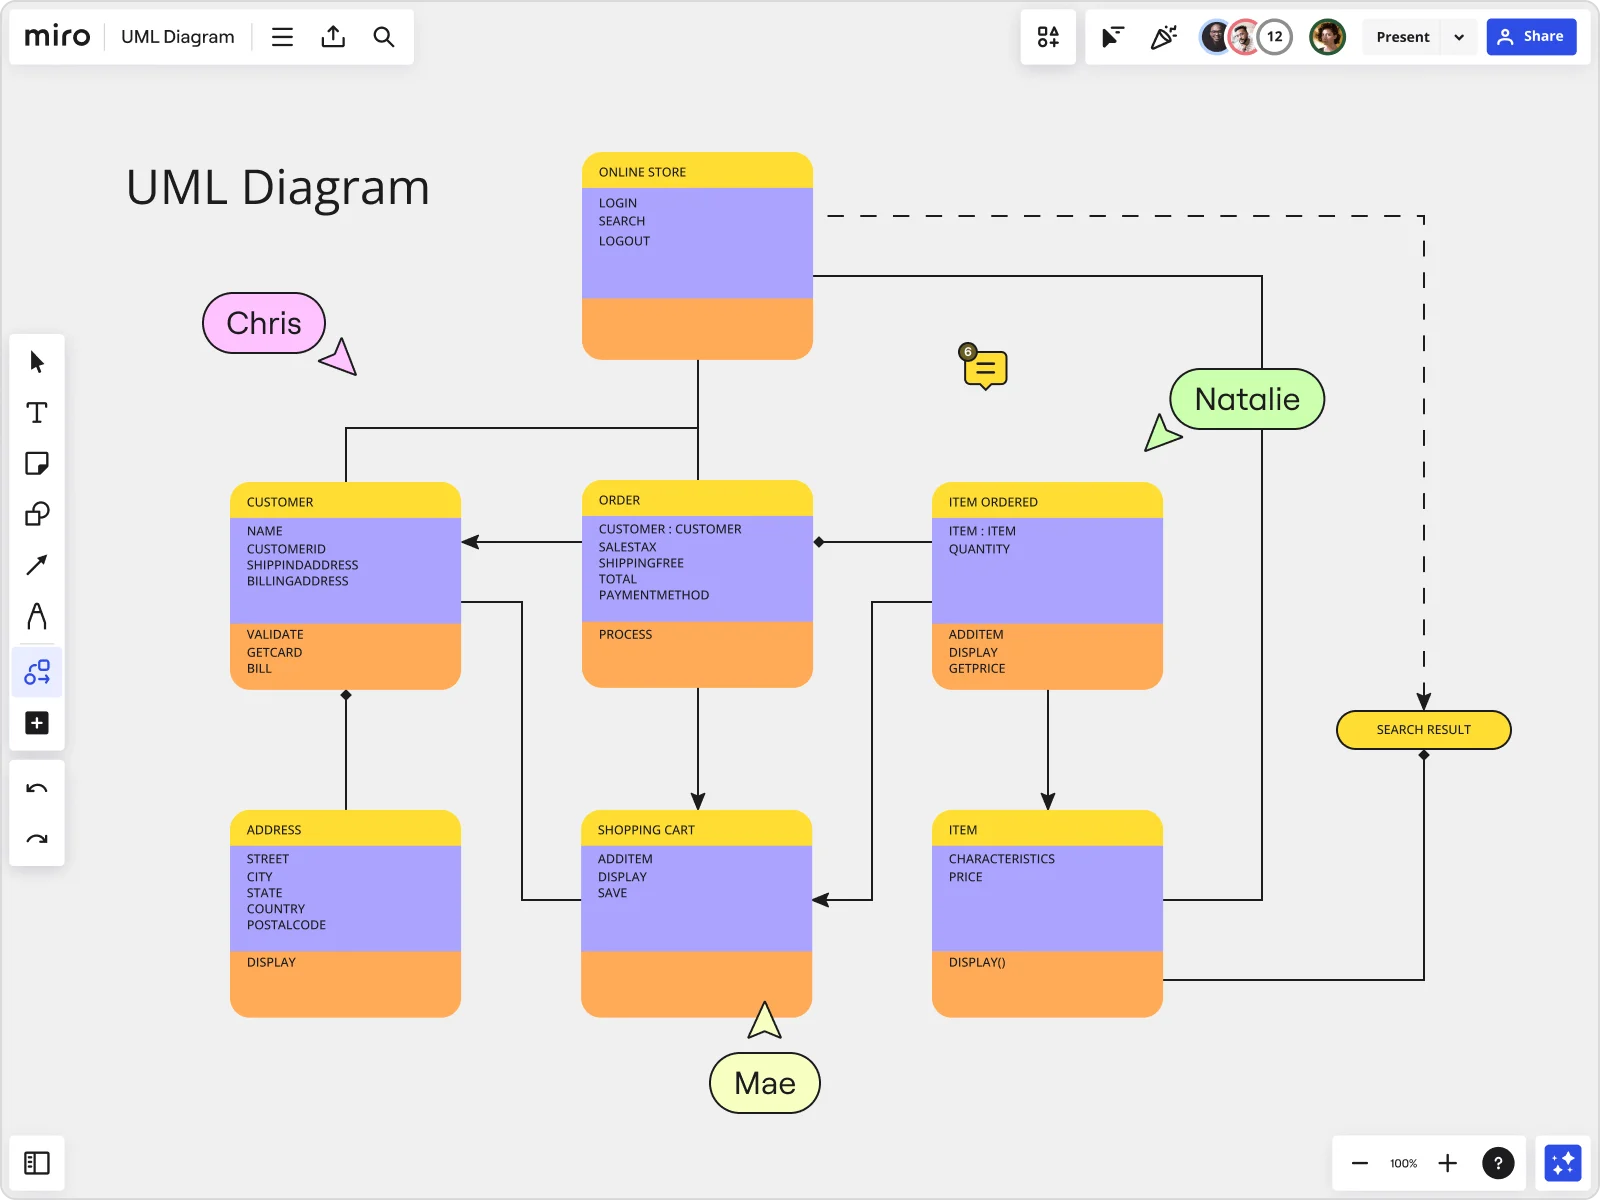
To create UML diagrams that adhere to industry standards, you can use a ready-made template or build one from scratch with UML shapes and notations.
Block diagrams: Visualizing components and connections
Block diagrams illustrate the relationship between different components of a system or process. They provide a high-level overview of the system's structure by using blocks to represent individual components and their interconnections. Block diagrams are commonly used in engineering, electronics, and system design.
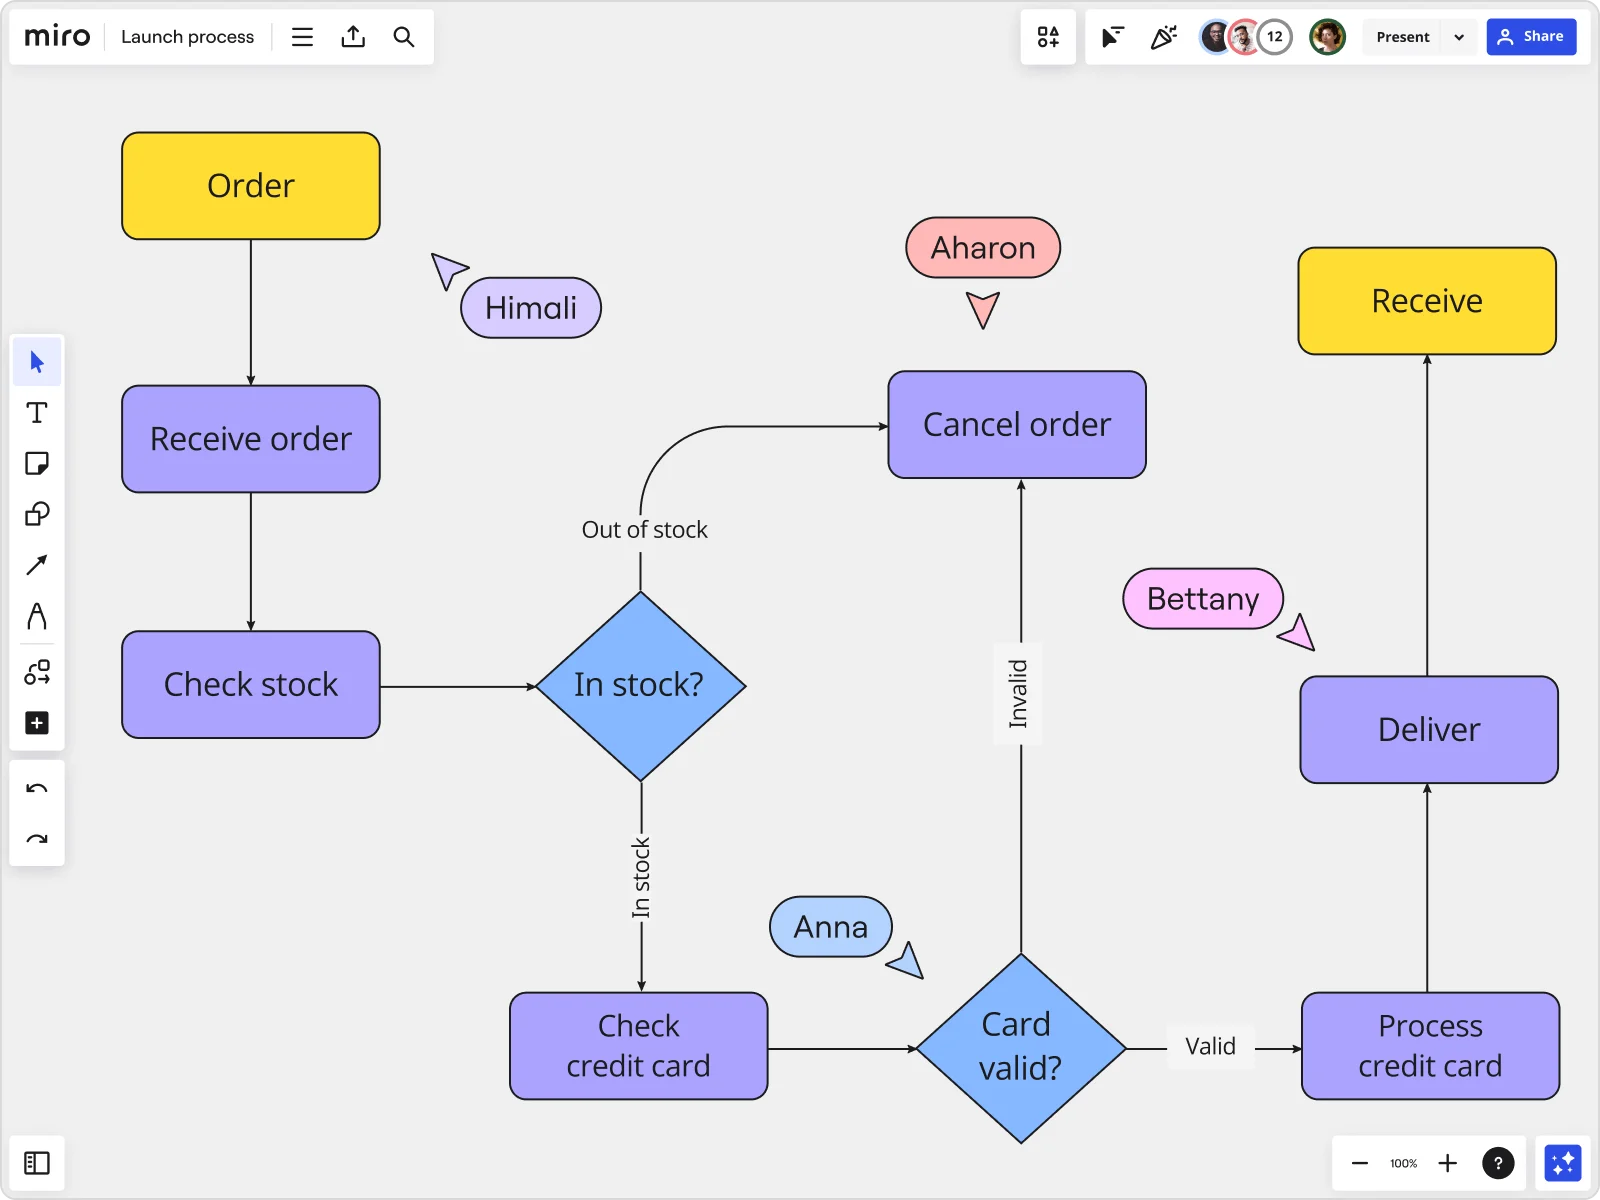
Block diagrams are intended to show the basic workings of a system, focusing on functionality and relationships over physical layout. That makes creating a block diagram a great way to provide a high-level overview of a system to non-technical stakeholders.
Data flow diagrams: Analyzing information flow
Data flow diagrams (DFDs) illustrate how data flows within a system. These diagrams focus on the way data moves through a system, from input to processing and then to output. They are widely used in systems analysis, software development, and business process modeling.

Making a data flow diagram provides a blueprint for system developers. They showcase how data is handled, making it easy to identify potential bottlenecks or inefficiencies and improve system design
BPMN diagrams: Modeling business processes
BPMN is a standardized graphical notation used to model business processes. It provides a visual representation of the steps, decisions, and interactions involved in a business process. BPMN diagrams enable organizations to analyze, optimize, and communicate their business processes effectively.
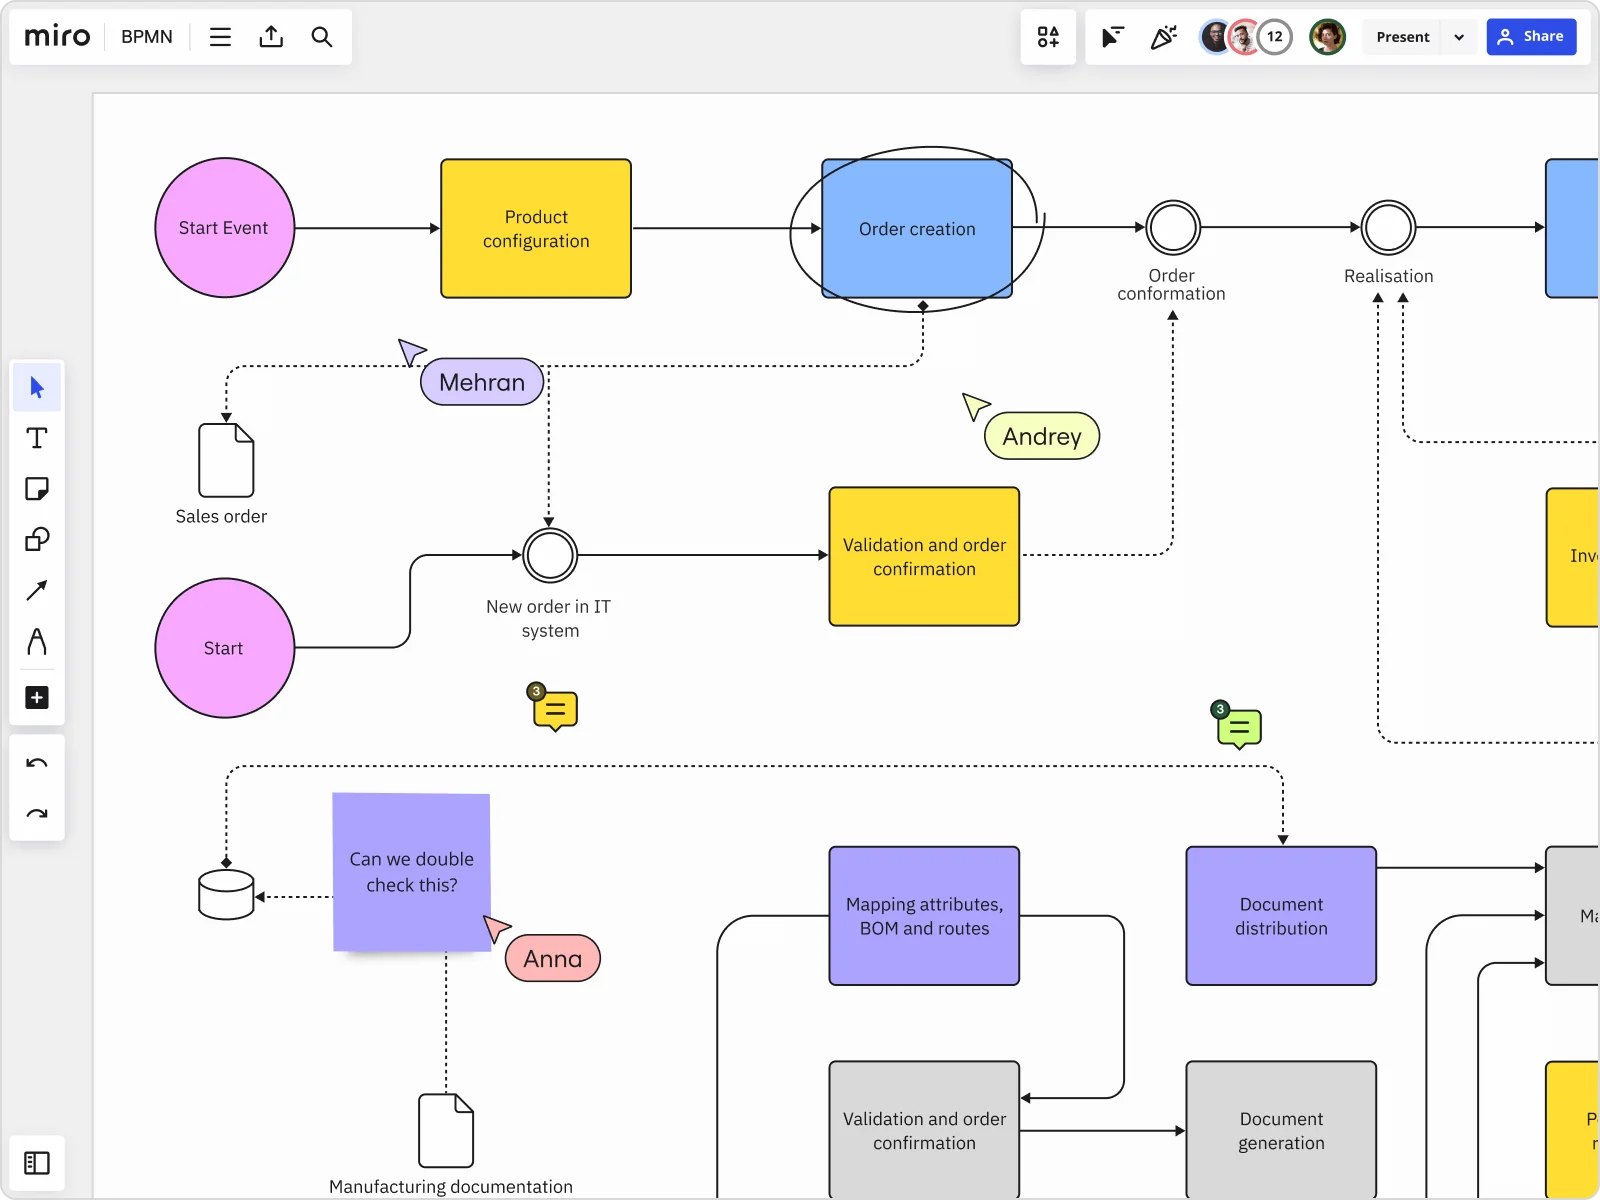
BPMN diagrams are designed to be easily understandable by all business stakeholders, including business analysts, technical developers, and business managers. This makes creating a BPMN diagram an effective tool for bridging the communication gap that can occur between business process design and implementation.
Sitemaps: Organizing website structure
Sitemaps, in the form of a tree diagram, visually represent the structure of a website, showcasing the hierarchy of pages and their interconnections. They enhance website navigation, improve user experience, and aid search engine optimization (SEO) efforts.
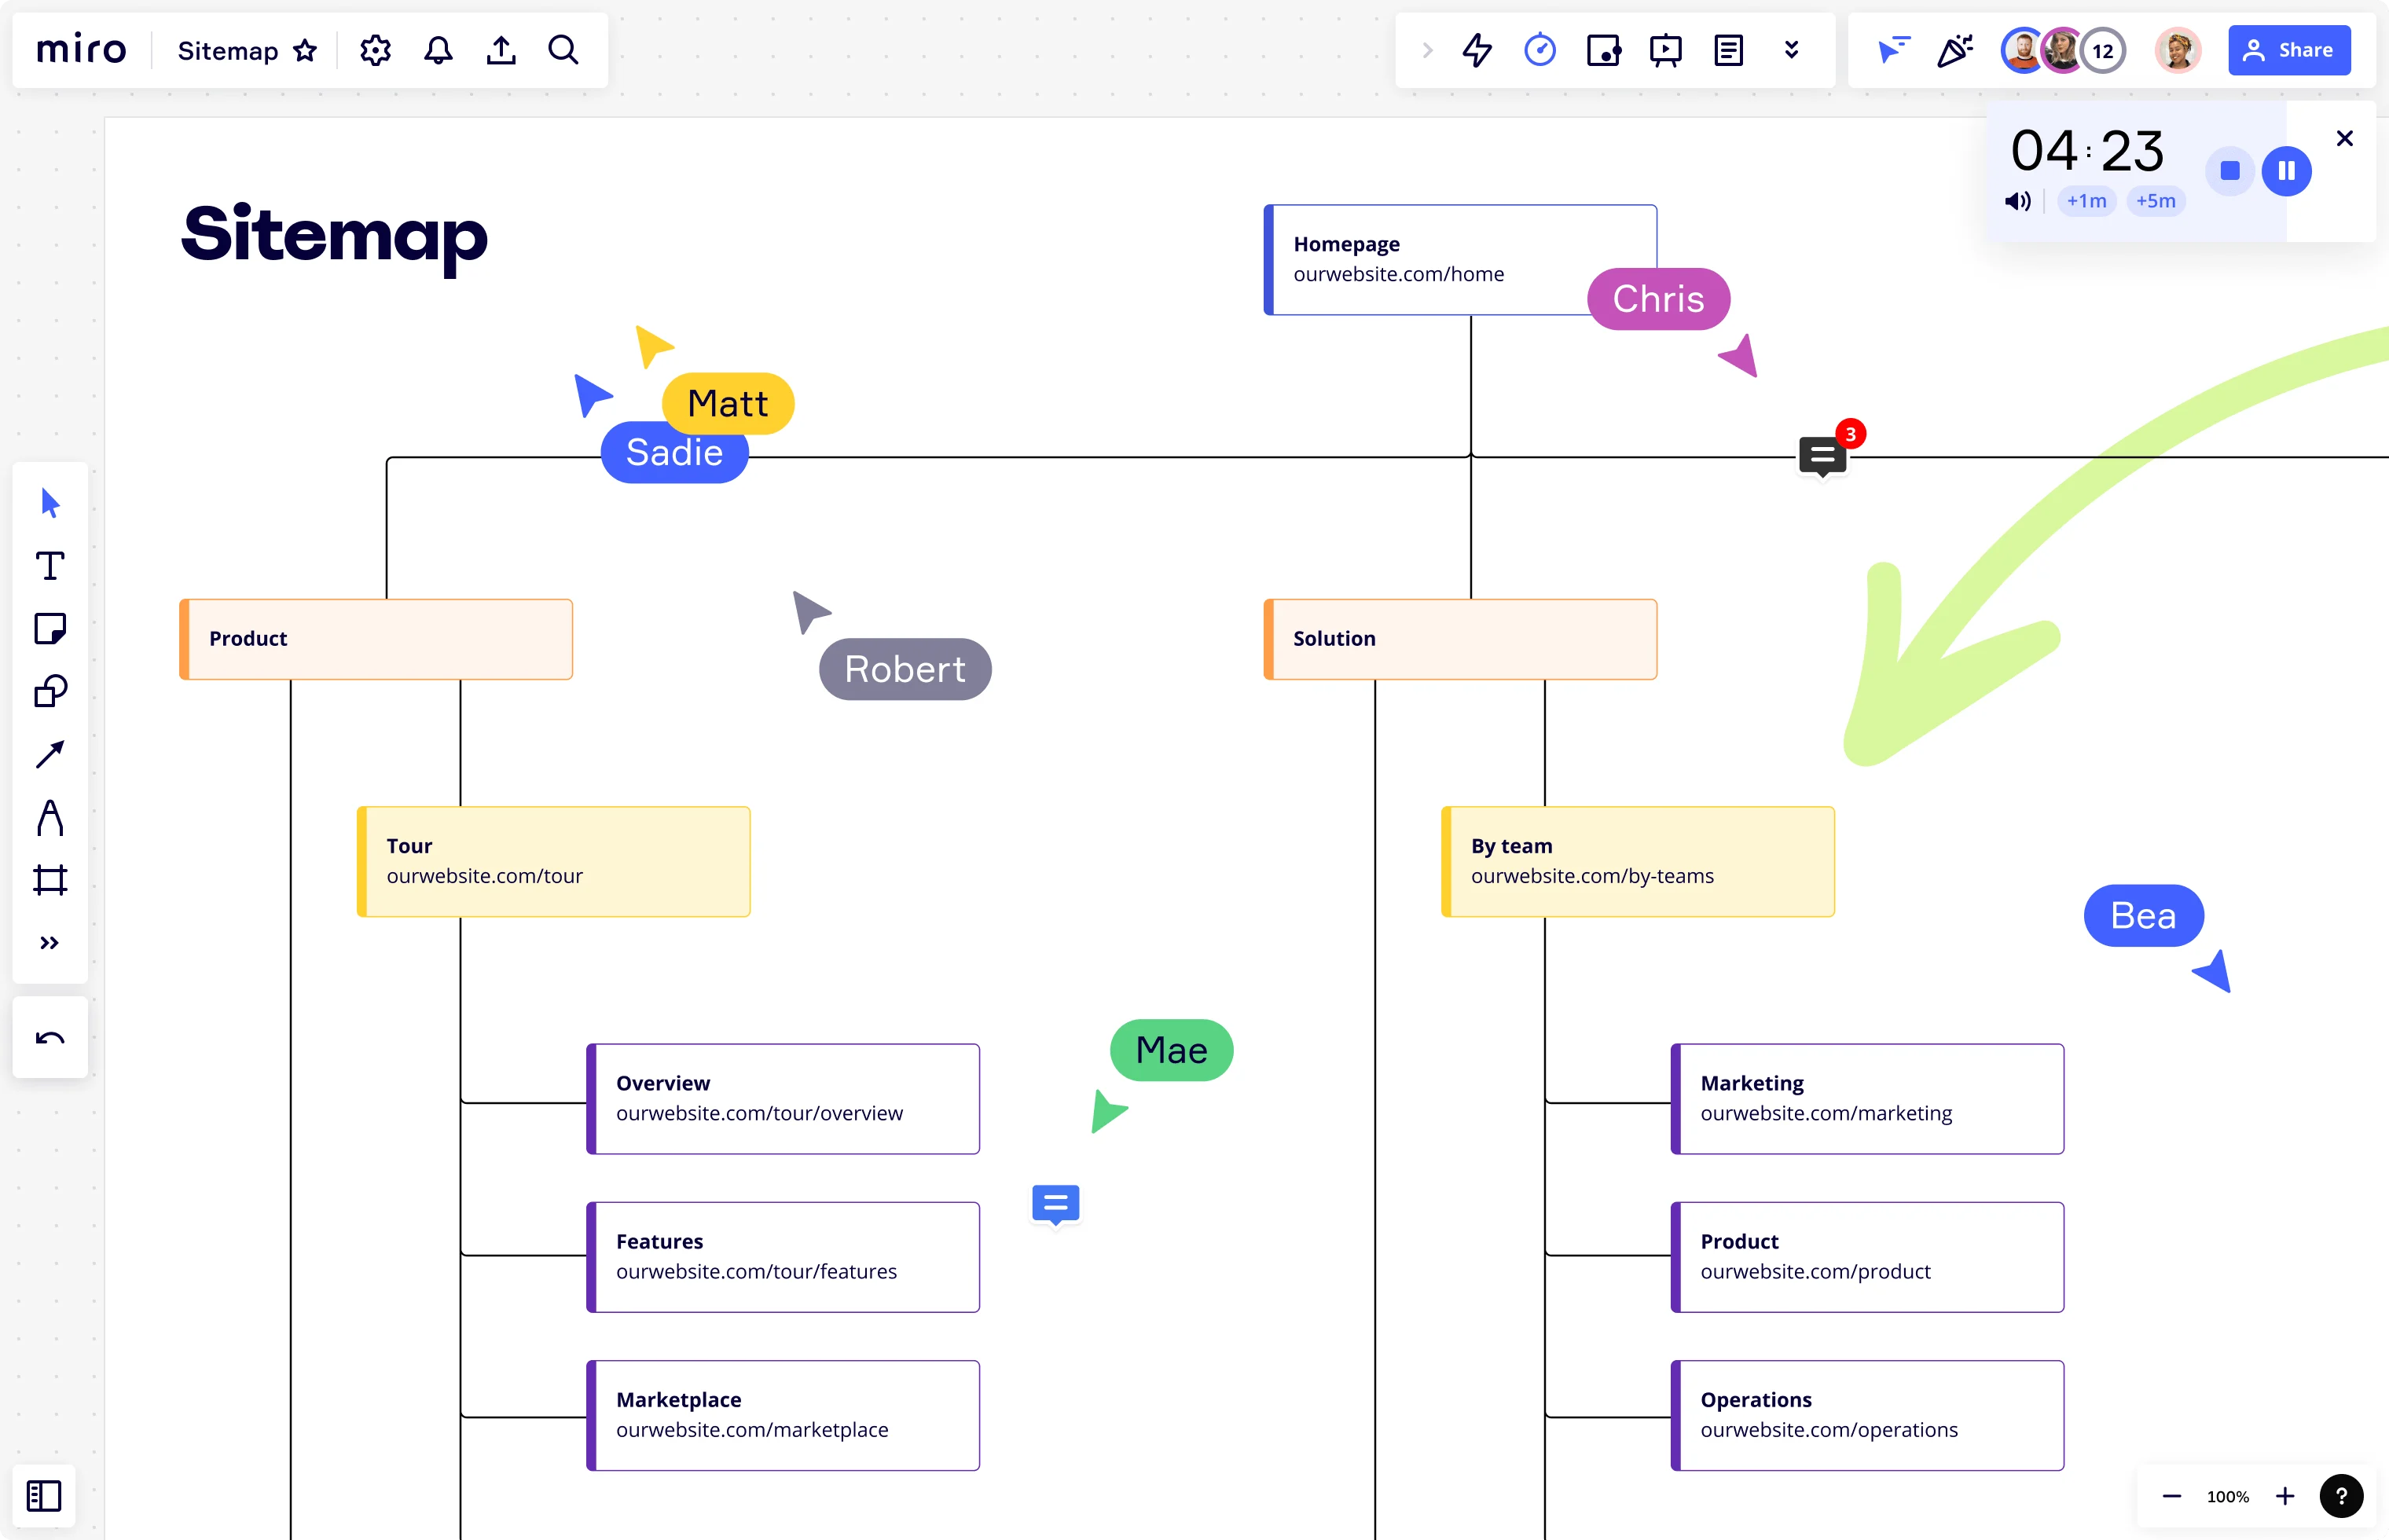
Miro's sitemap creator allows you to easily create and customize visual sitemaps, ensuring a logical and user-friendly website structure.
Organizational charts: Visualizing organizational structures
Organizational charts (also commonly known as org charts) are used to depict hierarchical structures, reporting relationships, and key roles within an organization. They provide a clear overview of the organization's structure, aiding in effective decision-making and resource allocation.
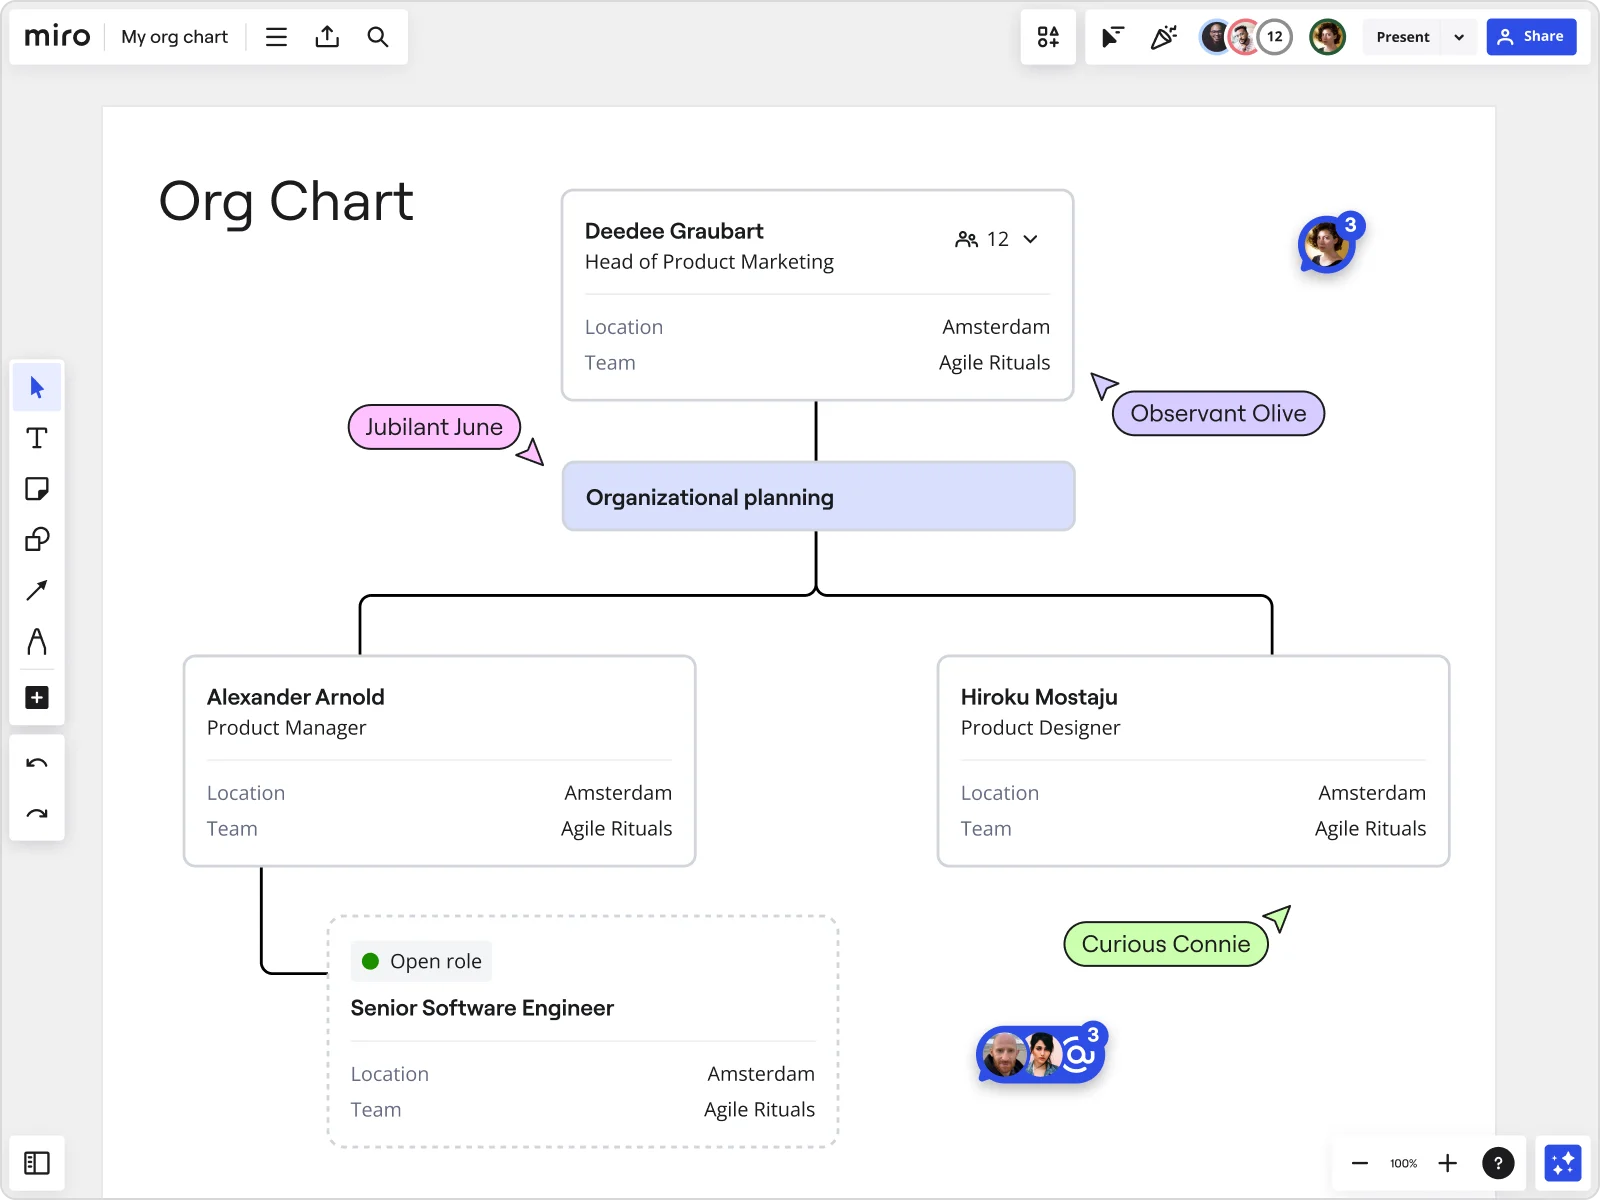
Creating an org chart is a necessity for any company. A clearly constructed organizational chart helps employees understand their role within the broader context, who they report to, and how their department fits into the organization.
Venn diagrams: Show connections between datasets
A Venn diagram is the perfect visual tool if you’ve ever wondered how different concepts overlap. With its signature intersecting circles, it’s ideal for showing relationships and shared characteristics between two or more sets of data.
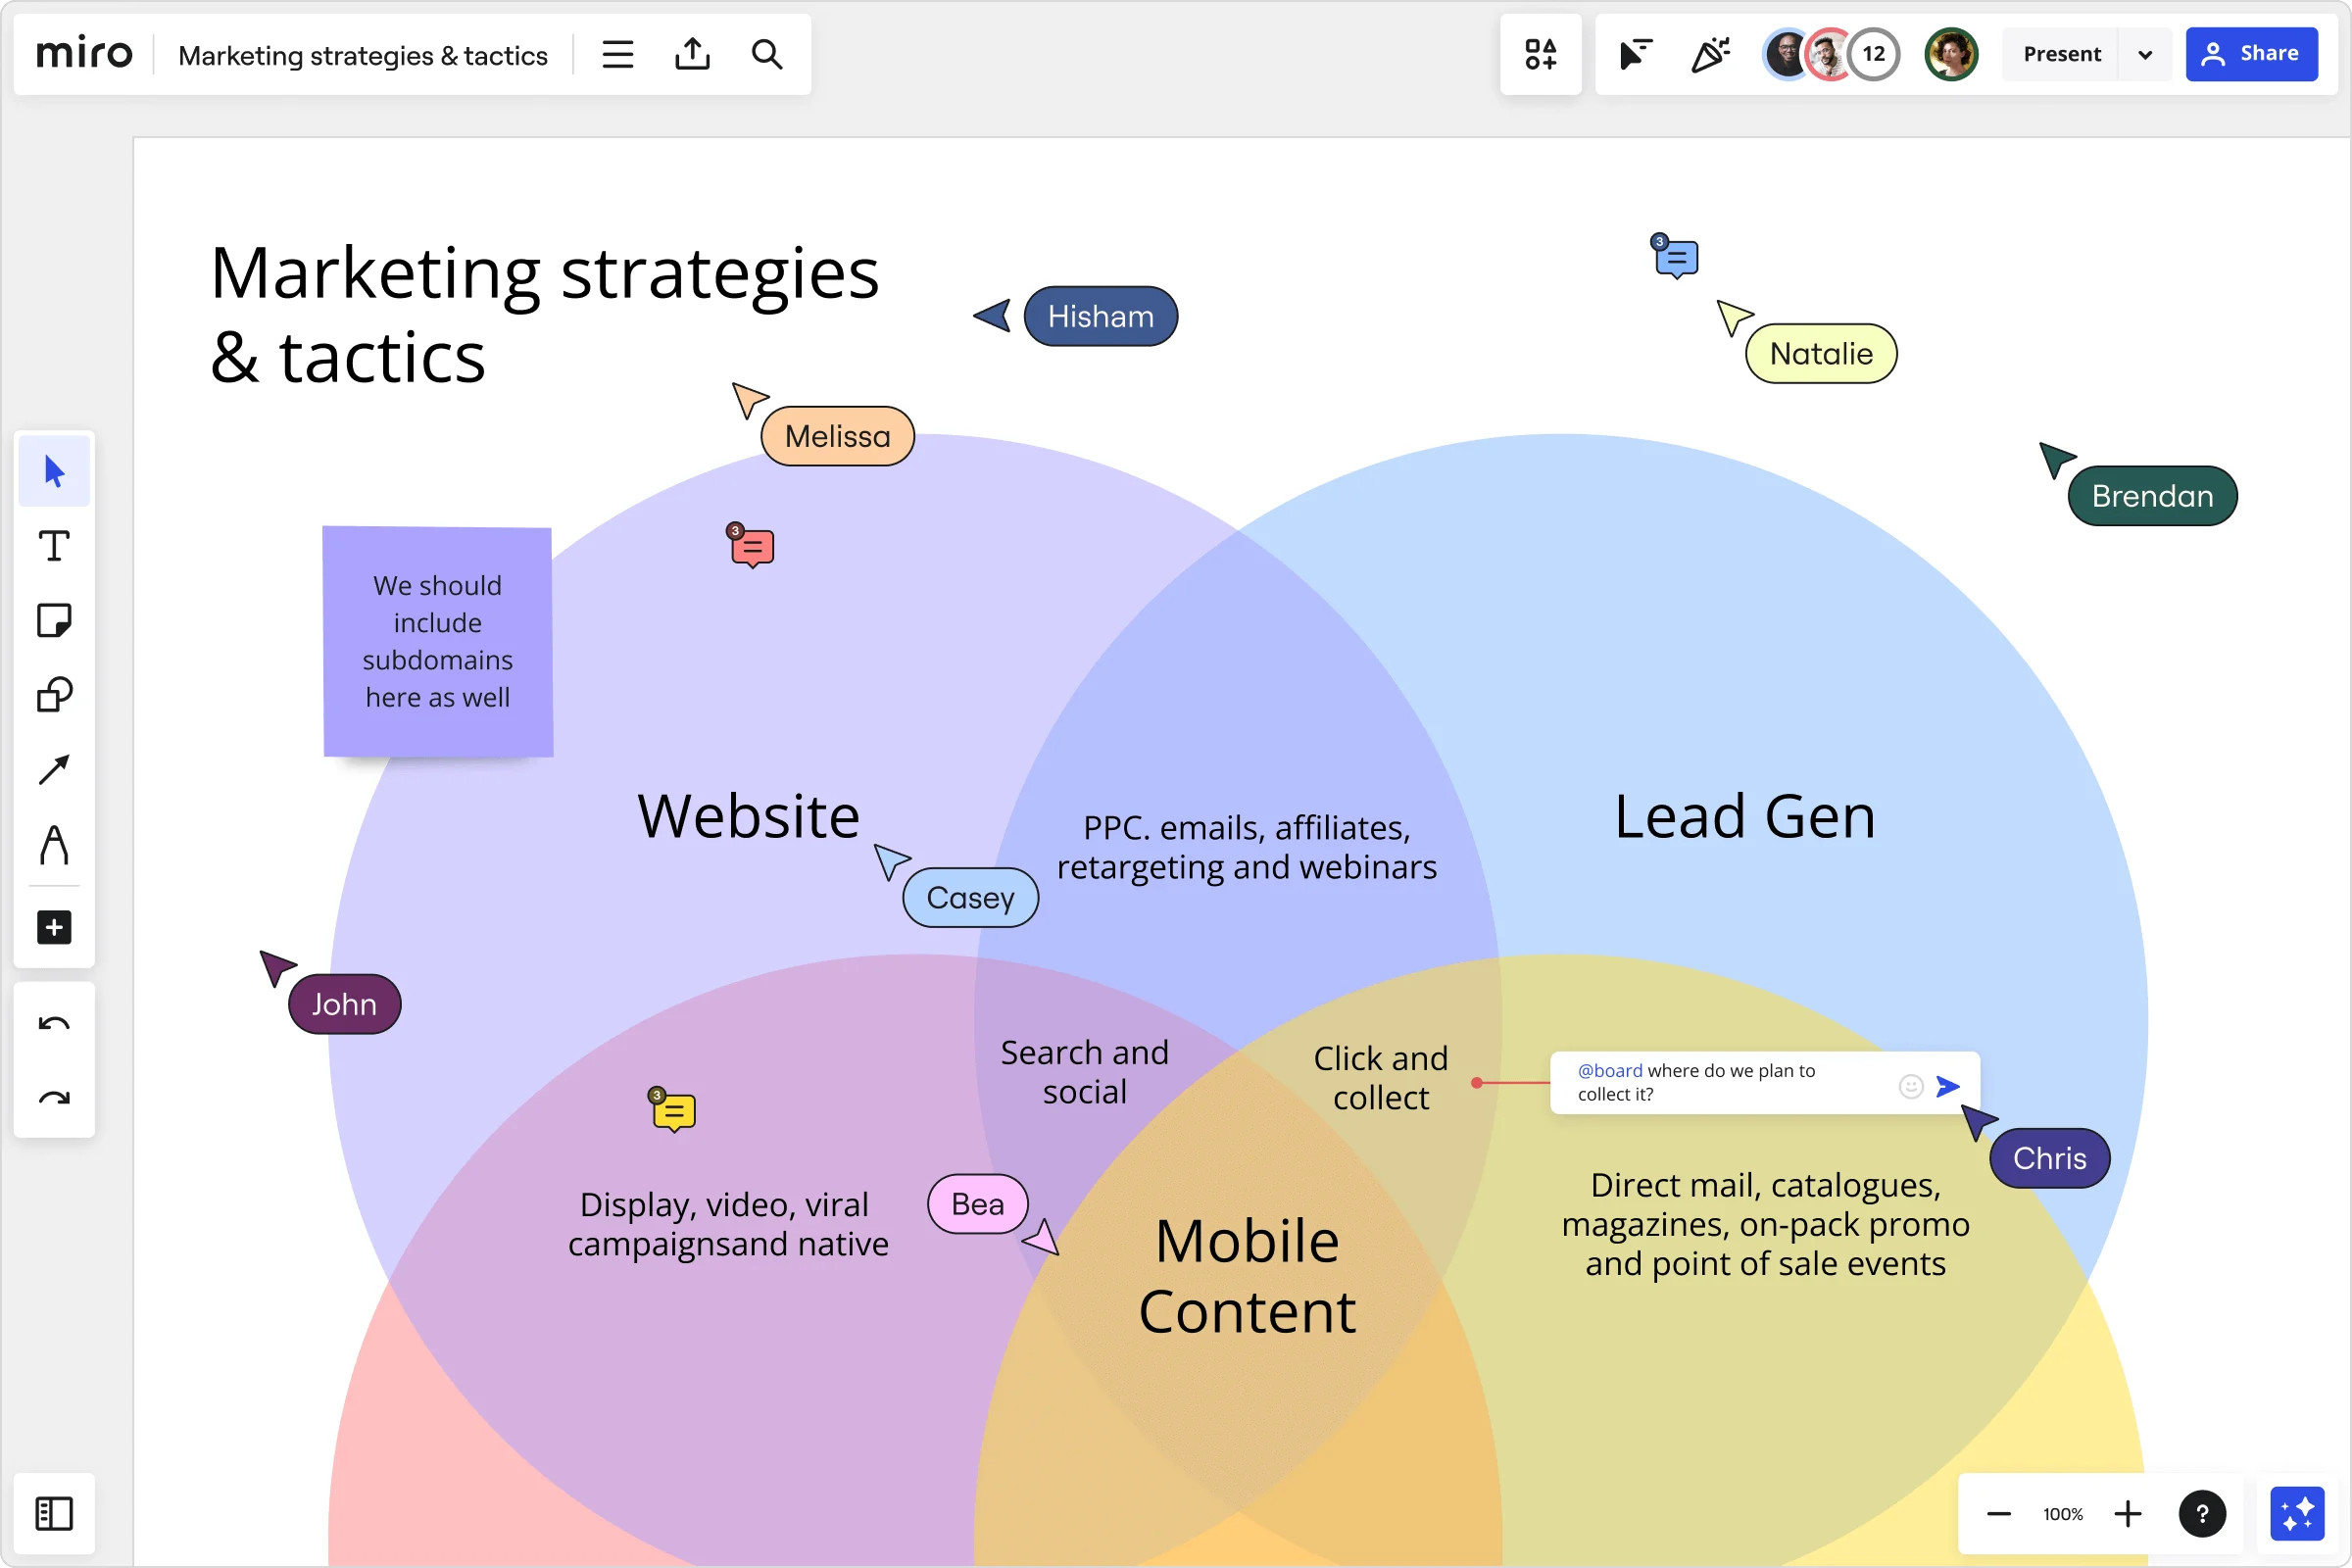
Venn diagrams are often used in decision-making, data comparison, and even UX design to highlight commonalities between user needs. Using a tool like Miro makes creating and customizing Venn diagrams a breeze. You can drop in shapes, adjust colors, and collaborate with your team in real time to make sure everyone's on the same page.
Spider diagrams: Untangle complex ideas
Need to brainstorm or organize your thoughts around a central concept? Spider diagrams (also called mind maps) help you break down big ideas into smaller, more manageable pieces. Think of it like a web, with the main idea in the center and related ideas branching out.
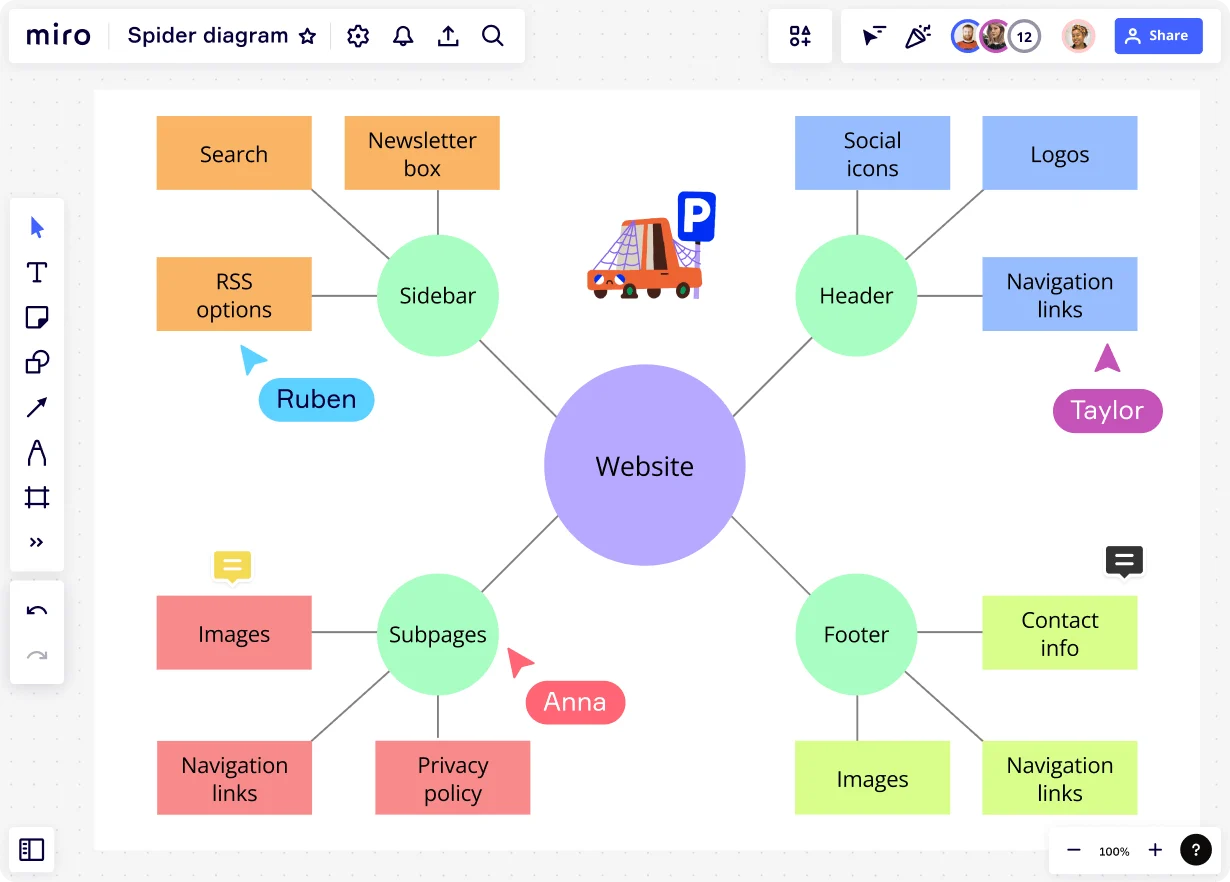
Spider diagrams are fantastic for product managers or designers who are tackling multifaceted projects. Whether you're brainstorming new features or mapping out a user journey, Miro makes it easy to create dynamic spider diagrams. And the best part? You and your team can collaborate both in real time and asynchronously—perfect for distributed teams.
Master diagramming with Miro
Understanding the various types of diagrams and their applications empowers people and organizations to effectively communicate complex concepts, streamline processes, and make informed decisions.
Whether you need to map out processes, design databases, model systems, or visualize structures, using the right diagramming tools can significantly improve your capabilities.
Each of these diagram types serves a different purpose, and with Miro's innovation workspace, you can easily explore and experiment with the one that best fits your project. Ready to level up your diagramming game? Explore Miro's diagramming tools and get started on your next project today.
Author: Miro Team
Last update: October 7, 2025