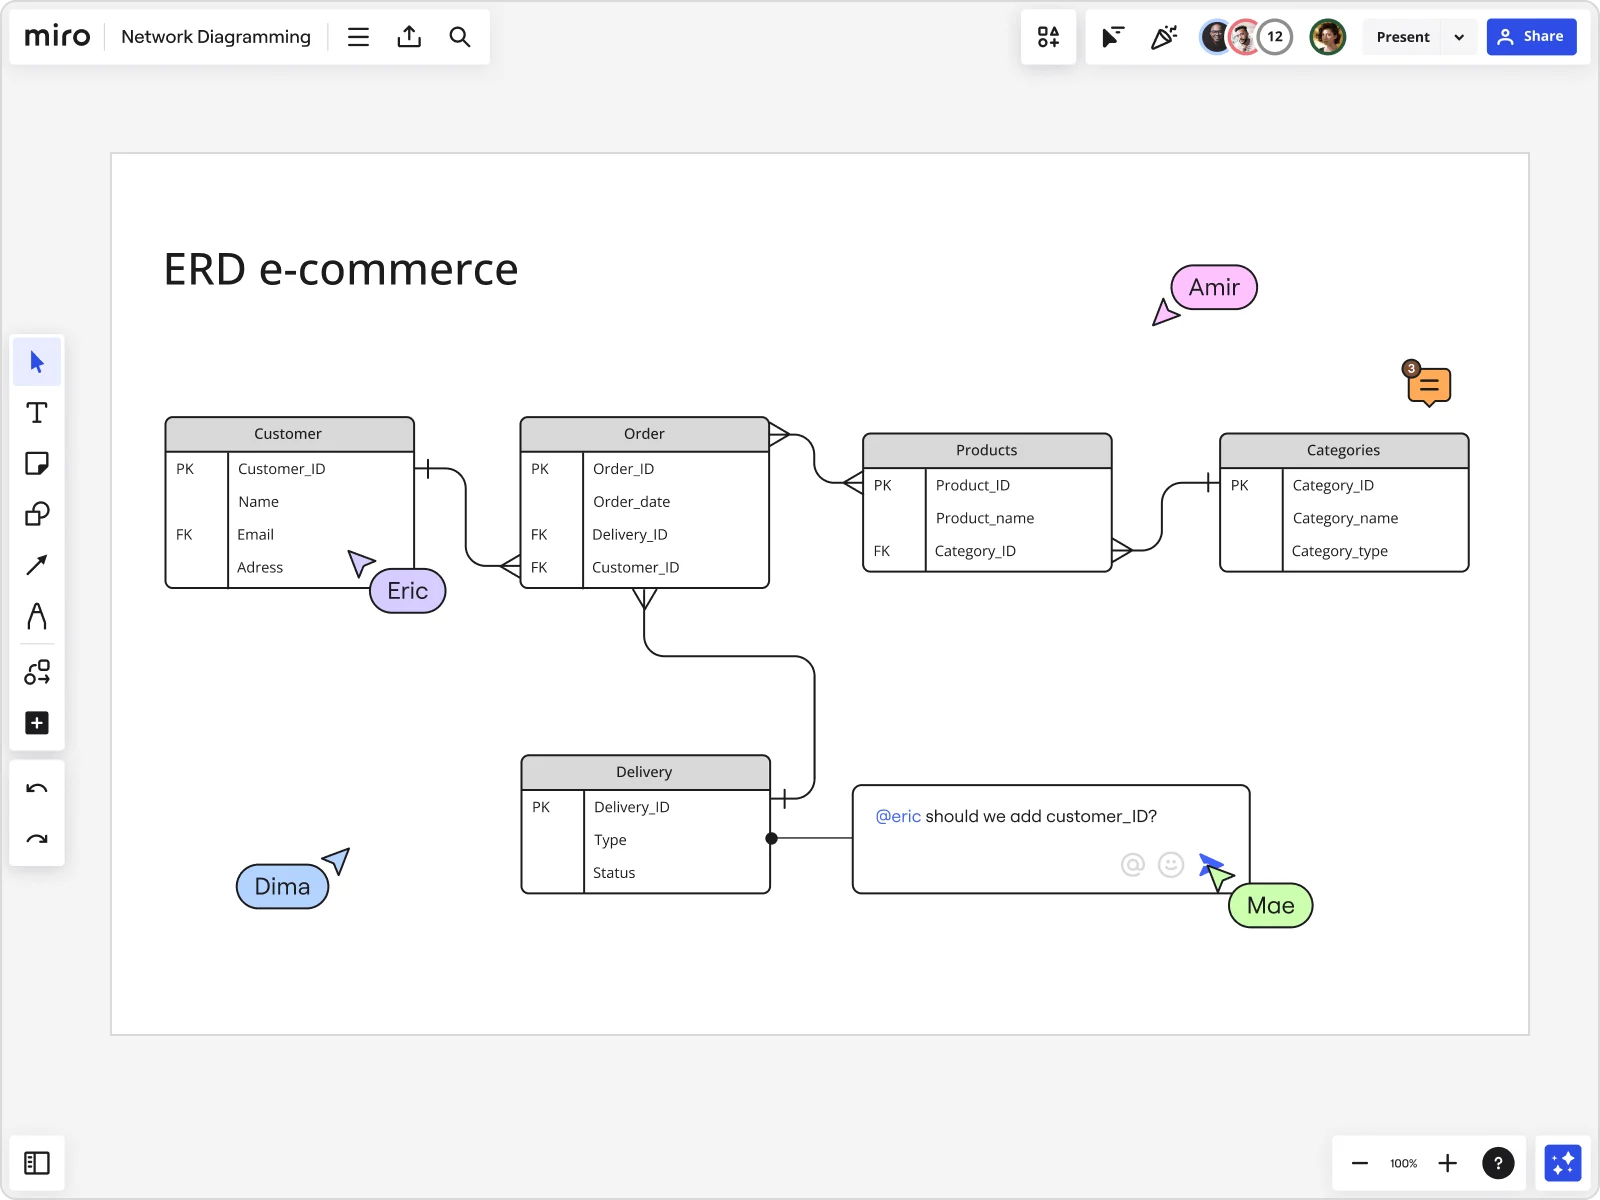
How to draw an ER diagram

Summary
In this guide, you will learn:
What an Entity Relationship (ER) diagram is and its purpose.
How to identify entities, relationships, and attributes.
Step-by-step instructions for drawing an ER diagram.
The importance of specifying cardinality and constraints.
How to use Miro’s ER diagram tool for creation.
Best practices for refining and sharing ER diagrams.
Try Miro now
Join thousands of teams using Miro to do their best work yet.
Drawing ER diagrams: All you need to know
ER diagrams, also known as entity relationship diagrams, are invaluable tools for visualizing and understanding complex data relationships. In this comprehensive step-by-step guide, we will walk you through the process of drawing an ER diagram, equipping you with the skills to create accurate and meaningful diagrams for your projects.
Preparing to draw an ER diagram
Before starting to draw an ER diagram, it is essential to gather requirements and identify the entities involved. This preparation phase sets the groundwork for creating a comprehensive and effective ER diagram.
Consider the following steps:
1) Start by understanding the goals and objectives of your project. Gather all necessary information about the system or database you are working with.
2) Identify the main entities involved in the system. These entities can represent real-world objects, concepts, or people.
3) Consider the relationships between the identified entities. Determine how they interact and depend on each other.
How to draw an ER diagram: Step-by-step guide
Now, let's dive into the step-by-step process of drawing an ER diagram, which will enable you to create a well-structured and visually appealing representation of the data relationships. You can use Miro's ER diagram tool to help you get started.
Step 1: Defining entities
Start by identifying the main entities in your system. Entities are objects or concepts that have data to be stored. For example, in a university database, entities might include "Student," "Course," and "Instructor."
As you record entities, also think about the associated attributes which will be included in your diagram. Attributes are the properties or characteristics that describe the entity. For example, attributes for the entity "Student" could include student ID, name, address, and date of birth.
Step 2: Establishing relationships
Establishing relationships between entities is a crucial aspect of an ER diagram. Relationships define how entities are connected or associated with each other. For example, a "Student" entity may be related to a "Course" entity through an "Enrolls In" relationship.
There are various ways relationships between entities are modeled. Cardinality, which refers to the numerical relationships between entities, describes the number of instances of one entity that can be related to the number of instances of another entity through a relationship.
Common relationship types include one-to-one (each instance of an entity is associated with exactly one instance of another entity, and vice versa), one-to-many, and many-to-many.
As you draw out relationships, also consider the participation constraints of each relationship. This determines whether a relationship is mandatory or optional for an entity.
Step 3: Adding attributes
Attributes provide additional information about entities. Add relevant attributes to the entities identified in the previous steps.
Specify the properties and characteristics of each attribute. For example, if you have an attribute called "Age" for the "Student" entity, define its data type (integer, string, etc.) and any constraints associated with it.
Step 4: Refining the Diagram
In this final step, we focus on refining the ER diagram to enhance clarity and readability. Organize the entities and relationships in a logical and intuitive manner. Group related entities together and arrange them in a way that reflects their connections.
Review the diagram for clarity, ensuring that it effectively communicates the relationships between entities. Share it with other stakeholders to get their feedback.
Tips and best practices for drawing an ER diagram
To ensure accuracy and optimize your ER diagram creation process, consider the following tips:
• Use proper naming conventions for entities and attributes to maintain consistency and clarity. Descriptive and meaningful names make the diagram more understandable.
• Keep the diagram concise, focusing on the most relevant entities and relationships. Avoid unnecessary complexity that might hinder comprehension.
• Validate the diagram against project requirements to ensure it accurately represents the system. Regularly review and update the diagram as the project progresses.
Tools for drawing ER diagrams
When it comes to drawing ER diagrams, having the right tool can make a significant difference in your productivity and the quality of your diagrams.
Miro's entity relationship diagram template provides a helpful starting point, allowing you to jump-start your diagramming process and customize it to fit your specific needs, or you can start from scratch by making a diagram with an ERD shape pack.
Conclusion
Drawing an ER diagram is a vital skill for effectively visualizing data relationships. With our comprehensive step-by-step guide, you now have the knowledge and expertise to create accurate and meaningful ER diagrams. Start leveraging the power of visualizing data relationships with confidence and take your projects to new heights.
Remember, practice makes perfect, so keep refining your ER diagramming skills and unlock new possibilities in data visualization.
Author: Miro Team
Last update: October 7, 2025