Map systems faster with Miro’s data flow diagram maker
A data flow diagram tool for development teams
Why Miro’s data flow diagram maker is the best
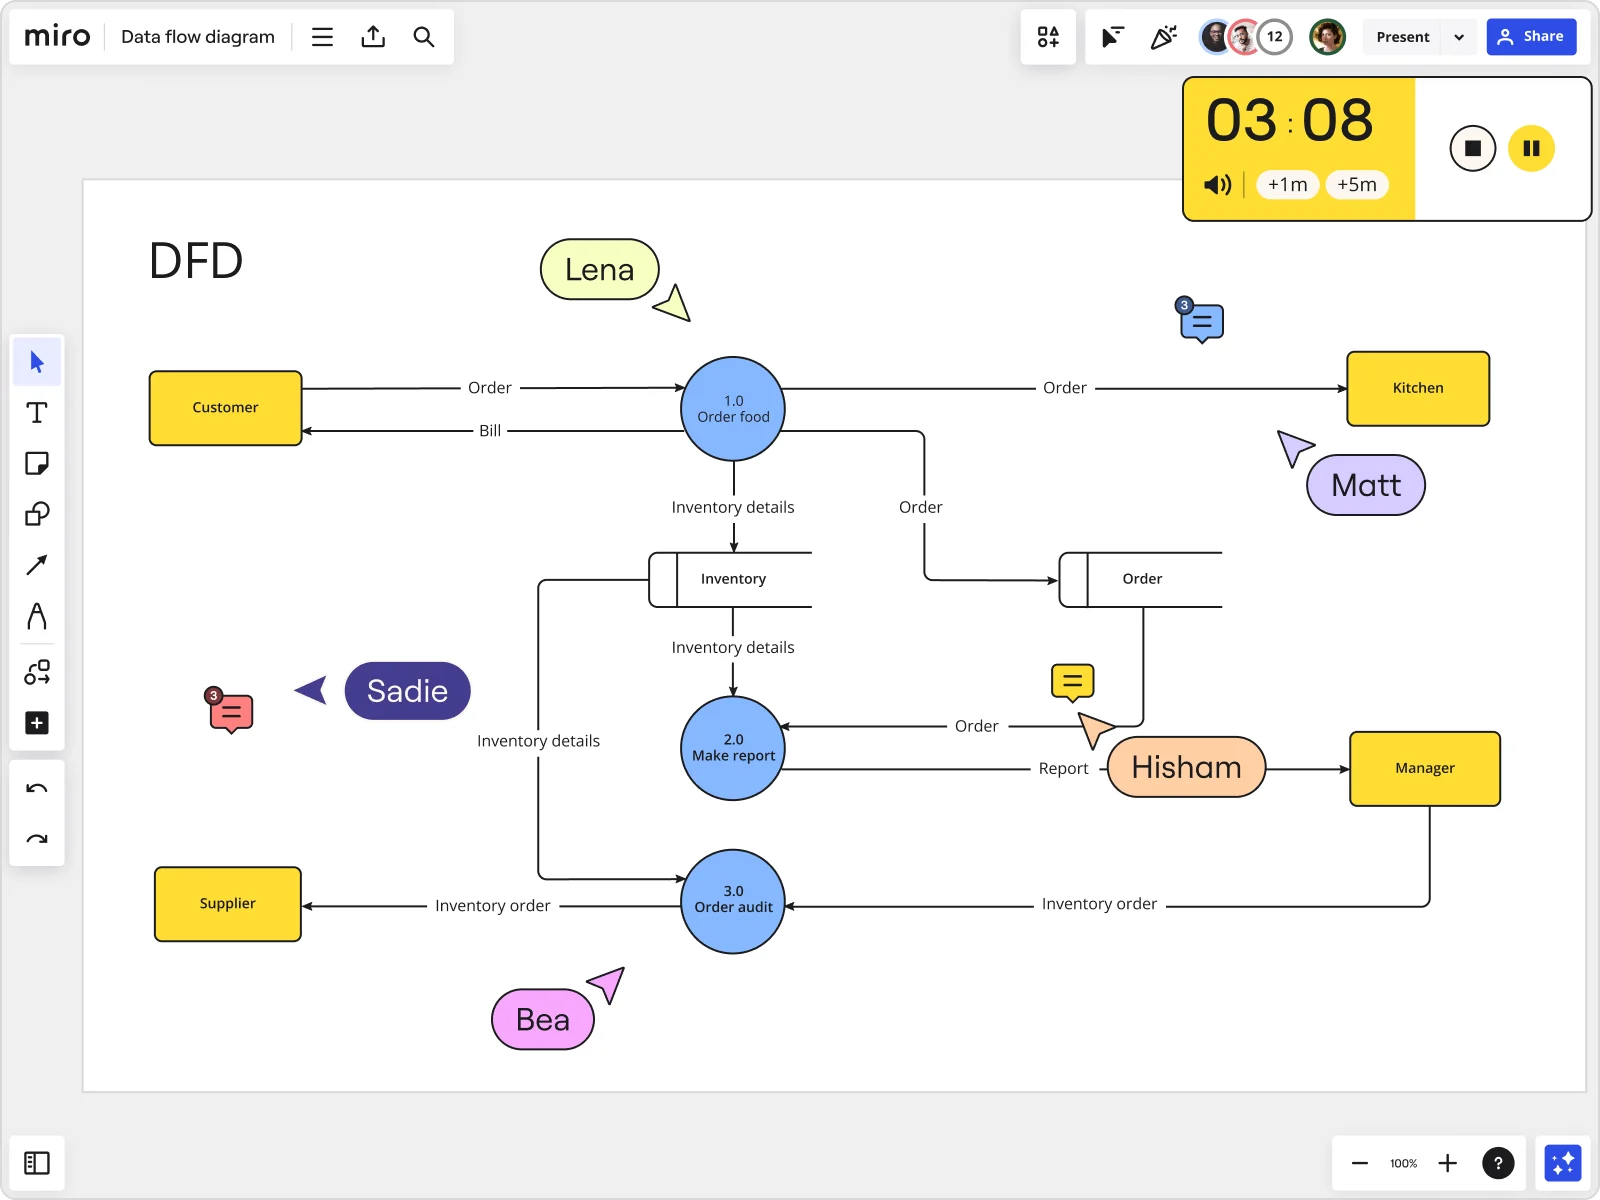
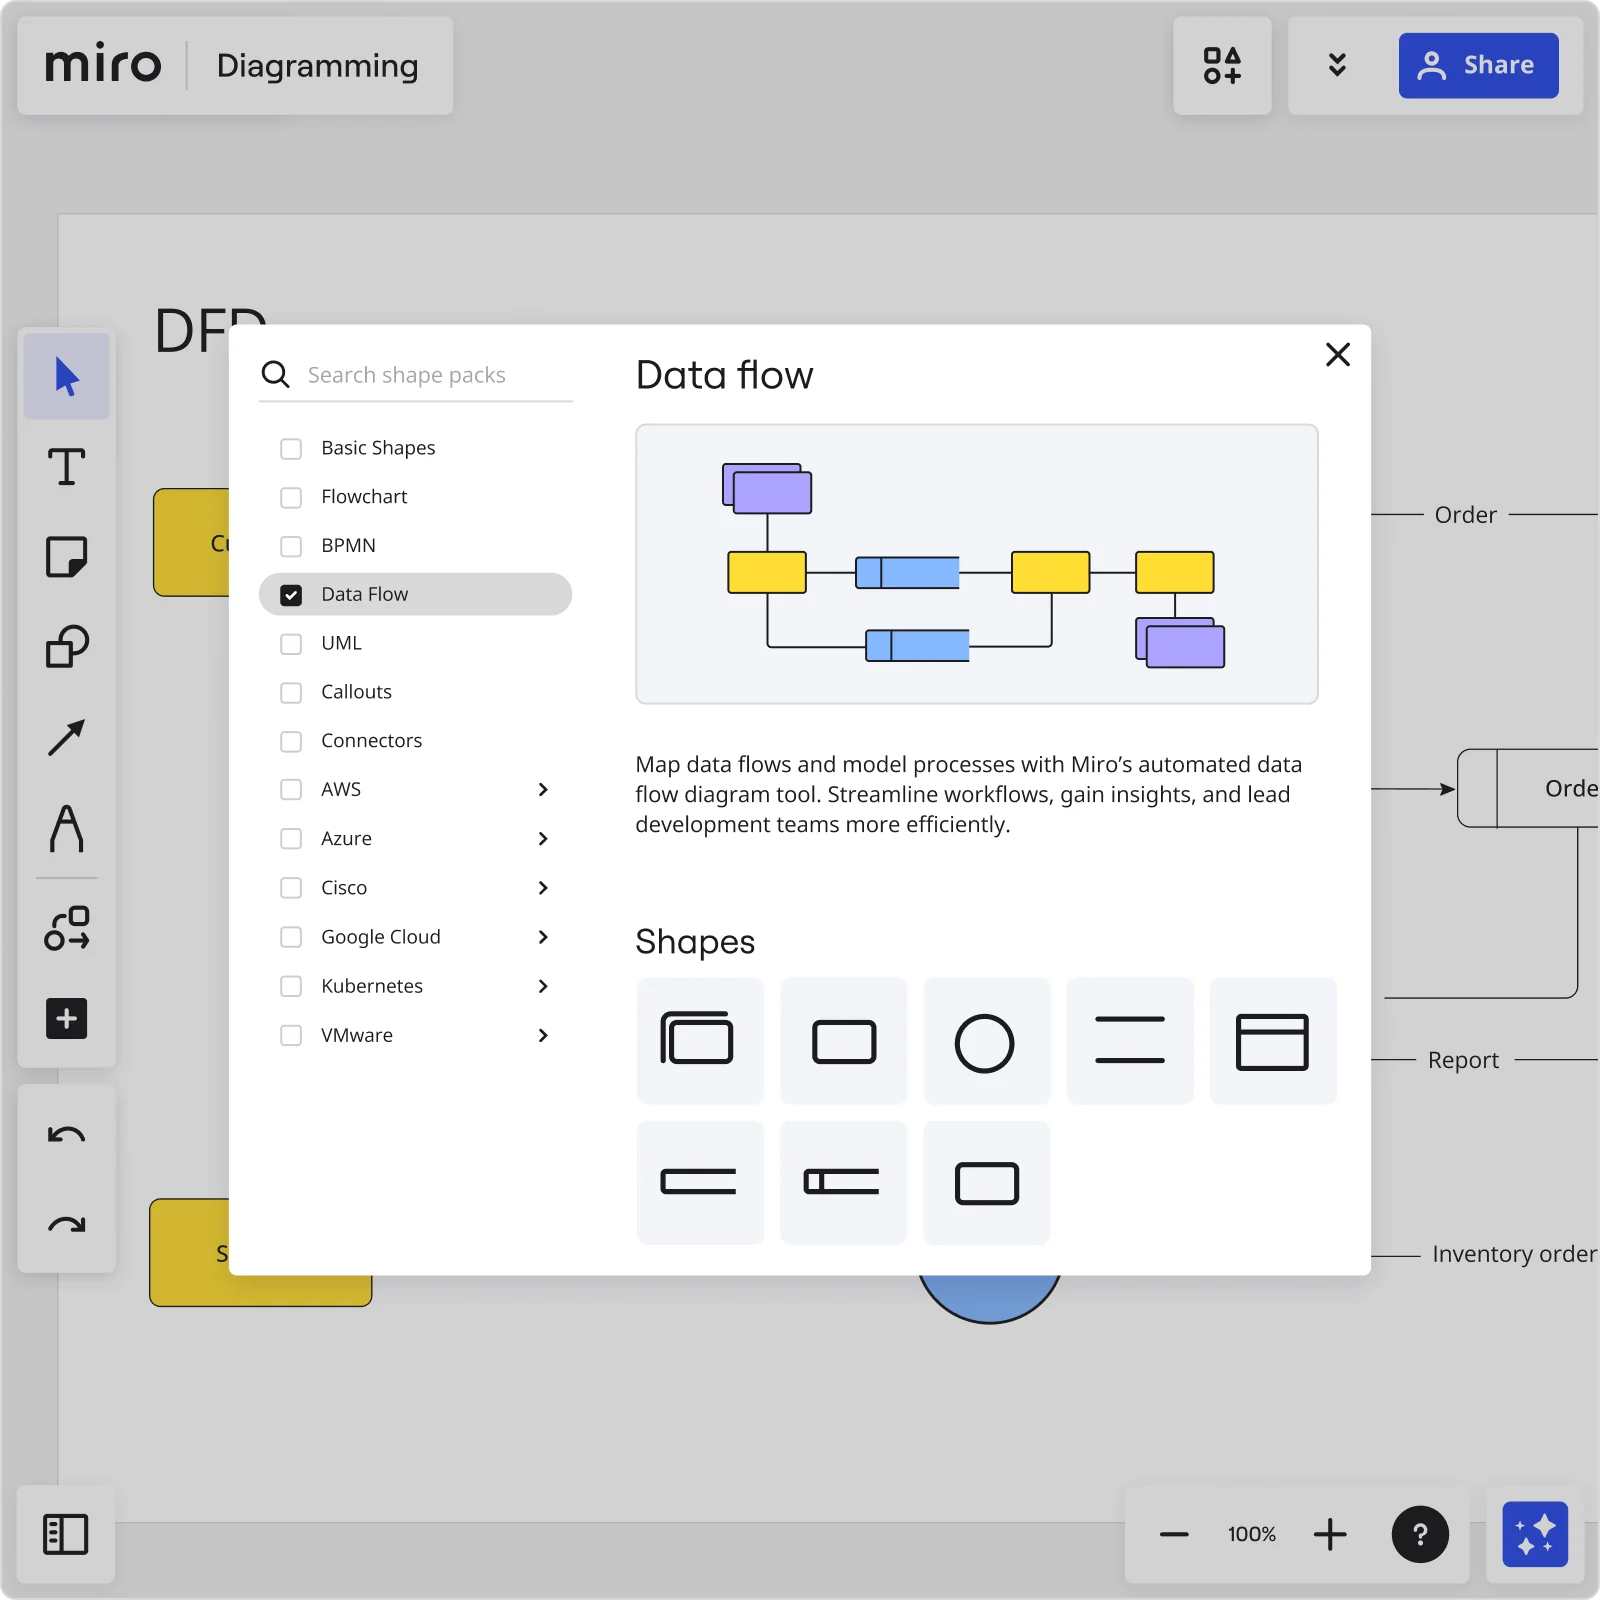
Use industry-standard shapes pack
Starting from scratch slows down the mapping process and leads to inconsistencies. Miro’s extensive diagramming capabilities allow you to diagram faster. Use the industry-standard shapes pack to create your data flow diagram quickly and clearly - no need to start from scratch. With predefined notations and customizable connectors, your team can create consistent diagrams that everyone understands.
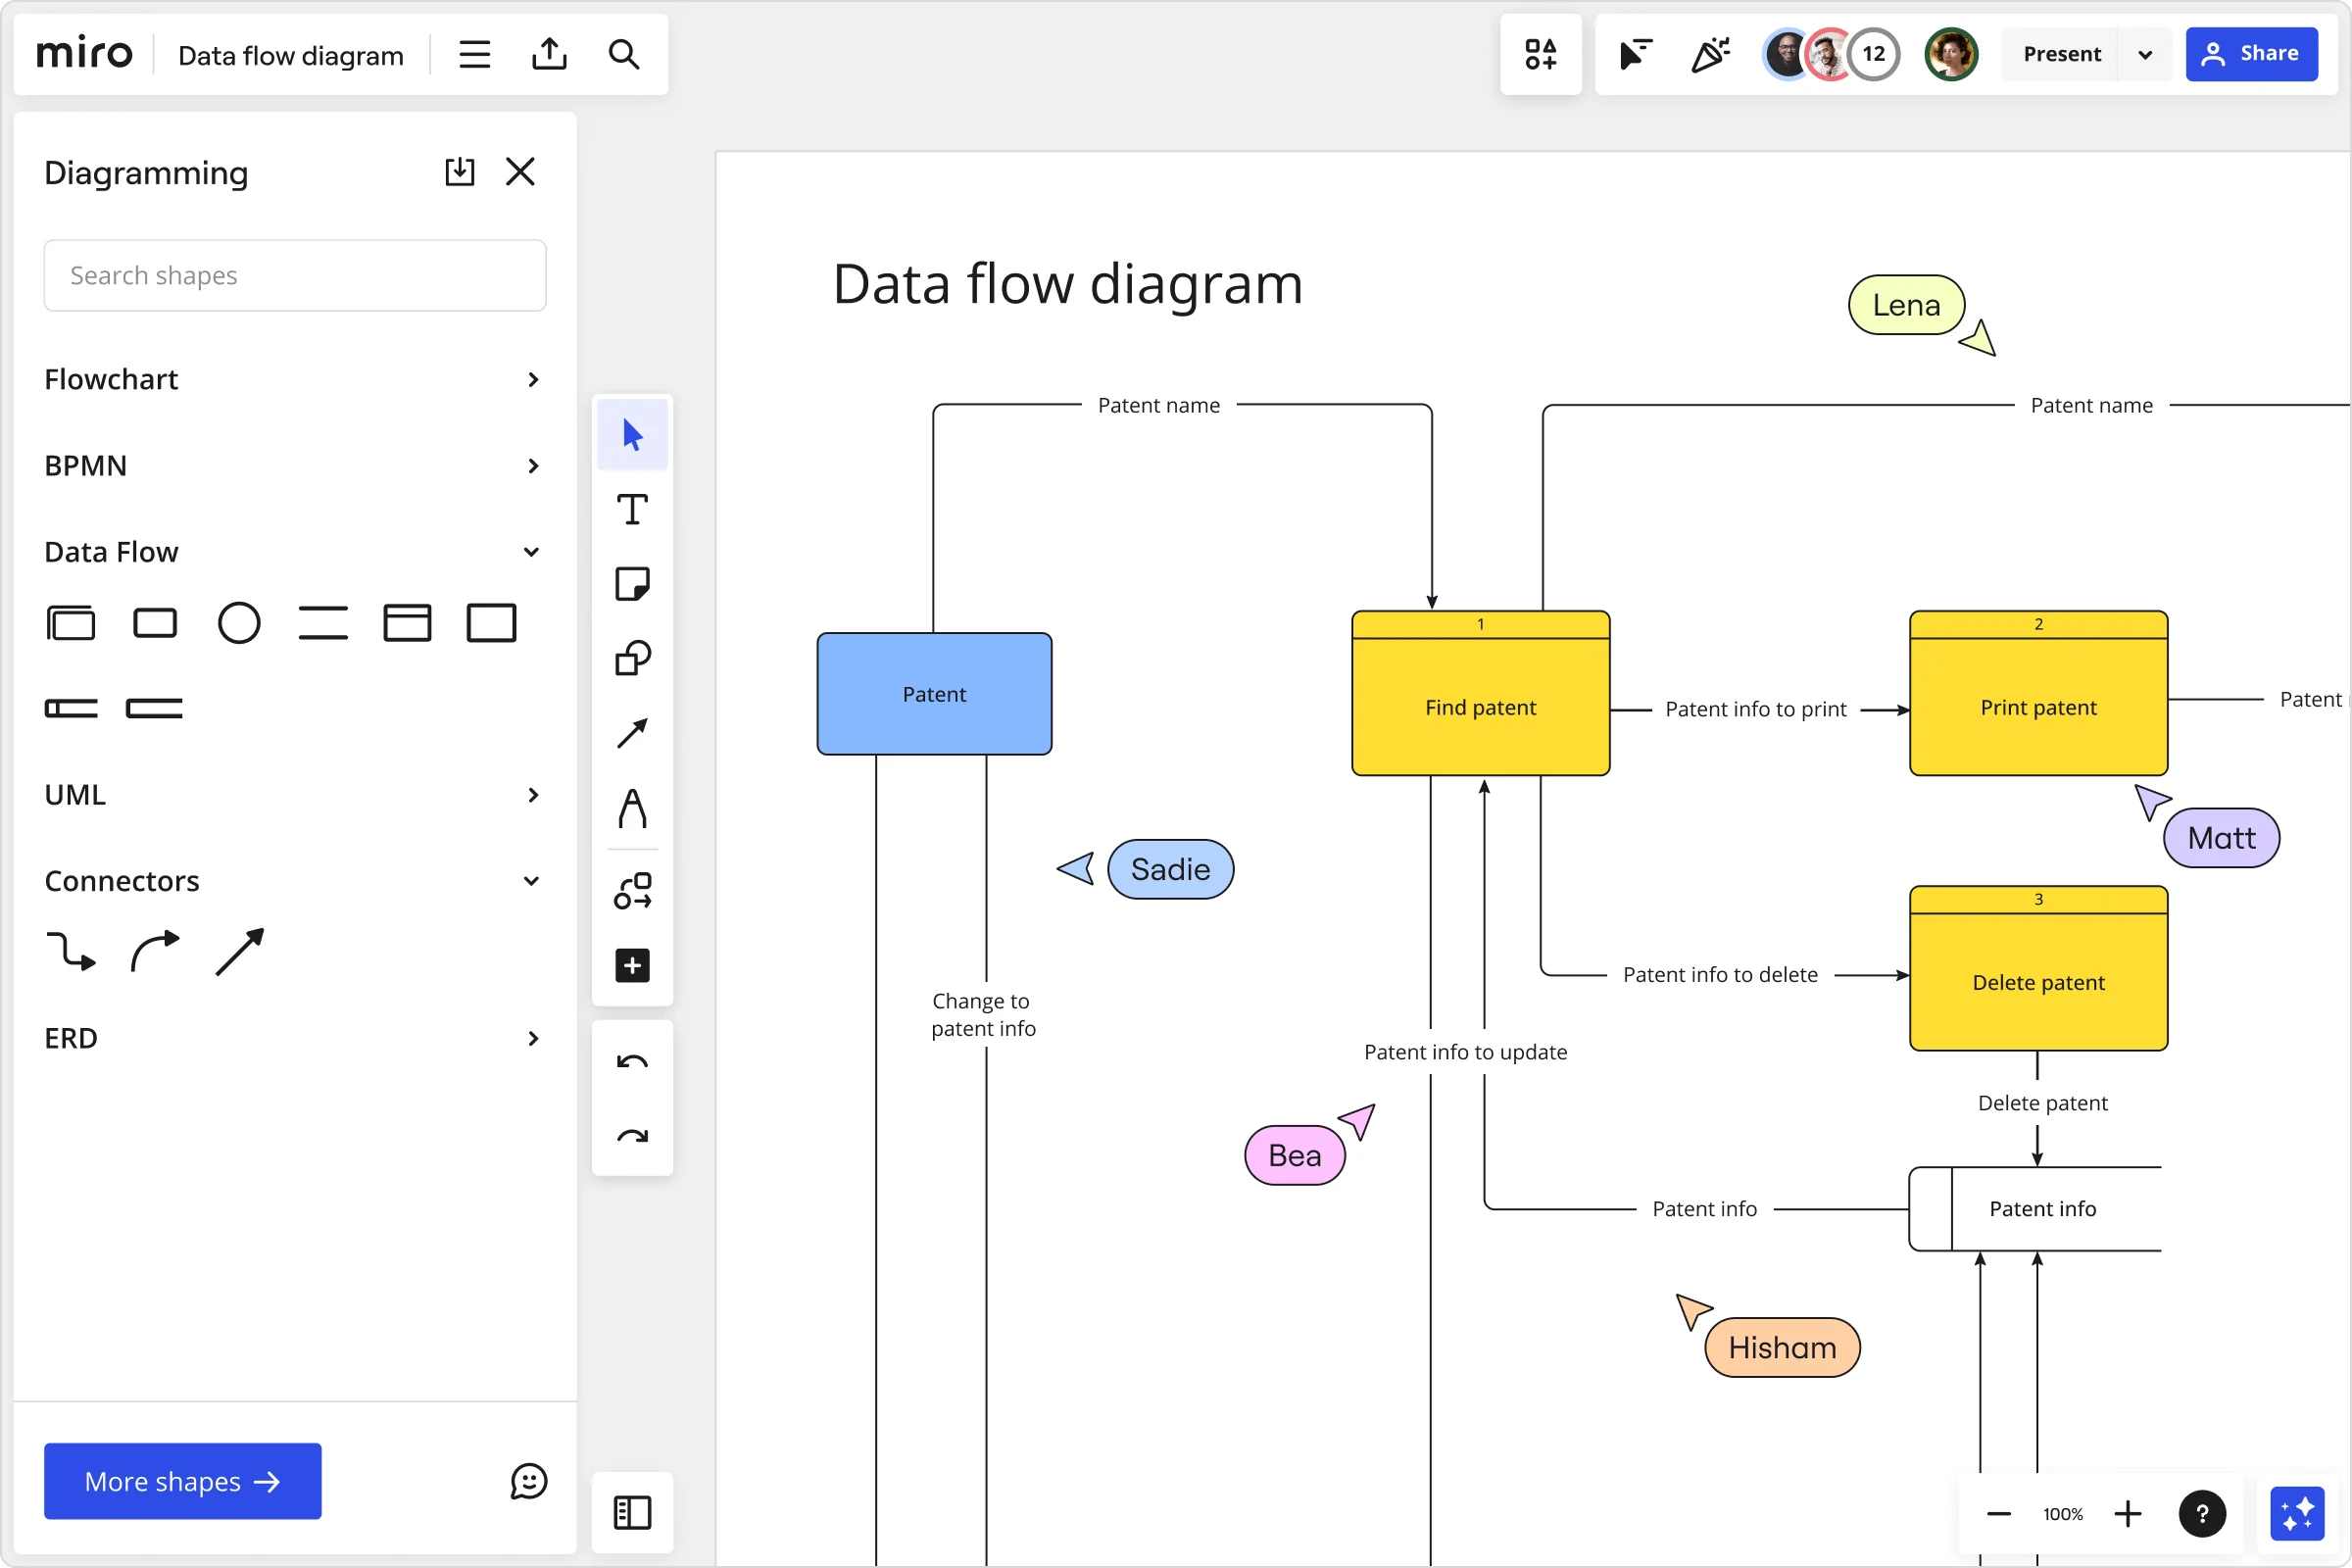
Optimize processes at ease
Manual modeling can make even small updates tedious. Create your data flow diagram using Miro's dedicated Diagramming mode. Use our curated diagramming toolbar for fast, accurate visual modeling - complete with smart connectors, layers, and auto-alignment features. You can visualize current and future states using layers, and easily upload custom shapes.
Accelerate workflows with Miro AI
Building complex data flow diagrams can take hours of manual mapping - Miro AI speeds it up. Use AI Shortcuts to transform inputs into connected visual models or summaries. Or, get real-time guidance from AI Sidekicks to refine relationships and ensure your diagram tells a clear story.
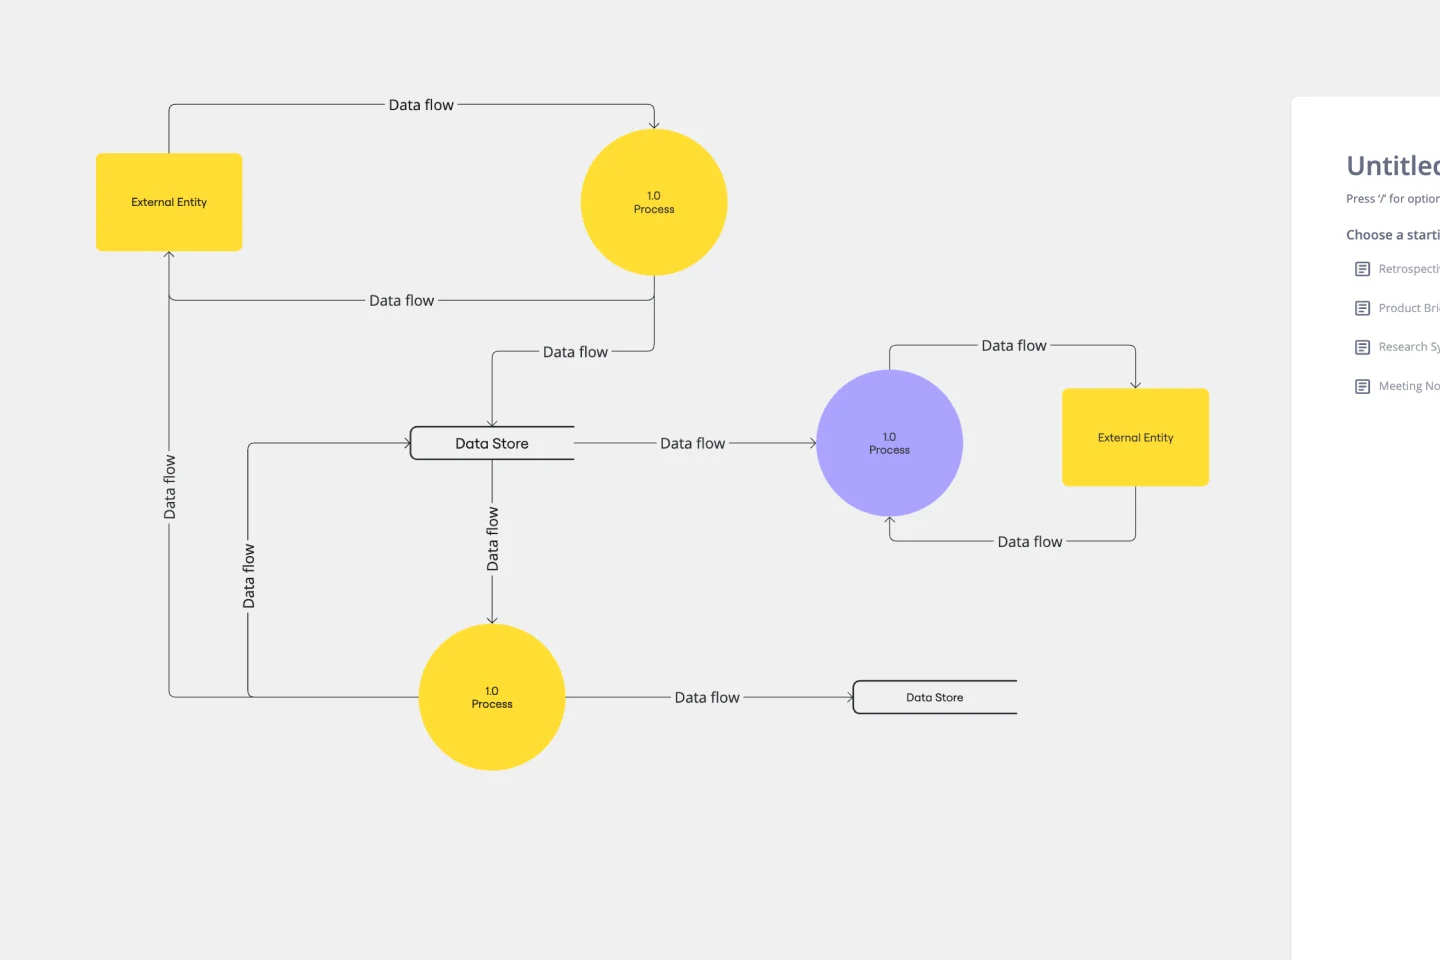
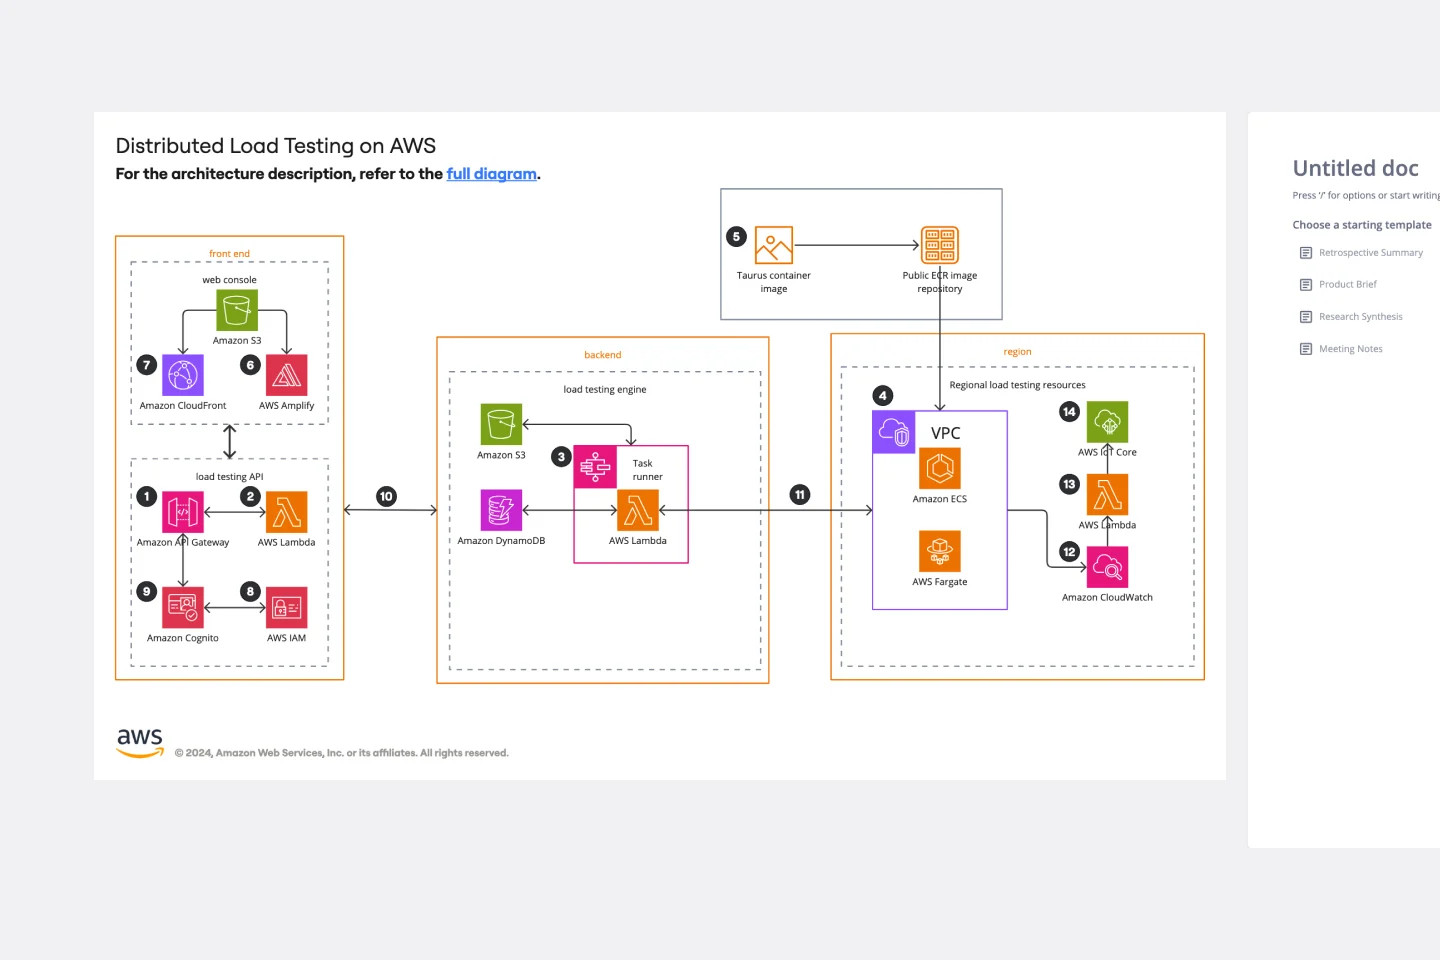
Visualize complete data flows
Fragmented visuals make it hard to see the bigger picture. Our infinite canvas gives you the space to expand your work, literally. Add related diagrams, documentation, screenshots, or flowcharts to your data flow visualization, creating a single, connected source of truth for your team. The board is limitless, helping you foster better communication and smart decision-making.
Better collaborate
Feedback scattered across tools can stall progress. Invite your entire crew to work together with you on your online data flow diagram. Use tagging and comment features to give and receive feedback in real time or async, or record Talktracks to share insights directly on the board. Miro’s extensive collaborative features help you bring your team together and keep everyone up to date.
Share your ideas
Static diagrams often limit collaboration and visibility. Export your work as an image or PDF in seconds, or embed it directly into presentations and documentation for easy reference. You can also duplicate frames, link boards, or add your data flow diagram to a larger workflow map, keeping your visuals connected across projects.
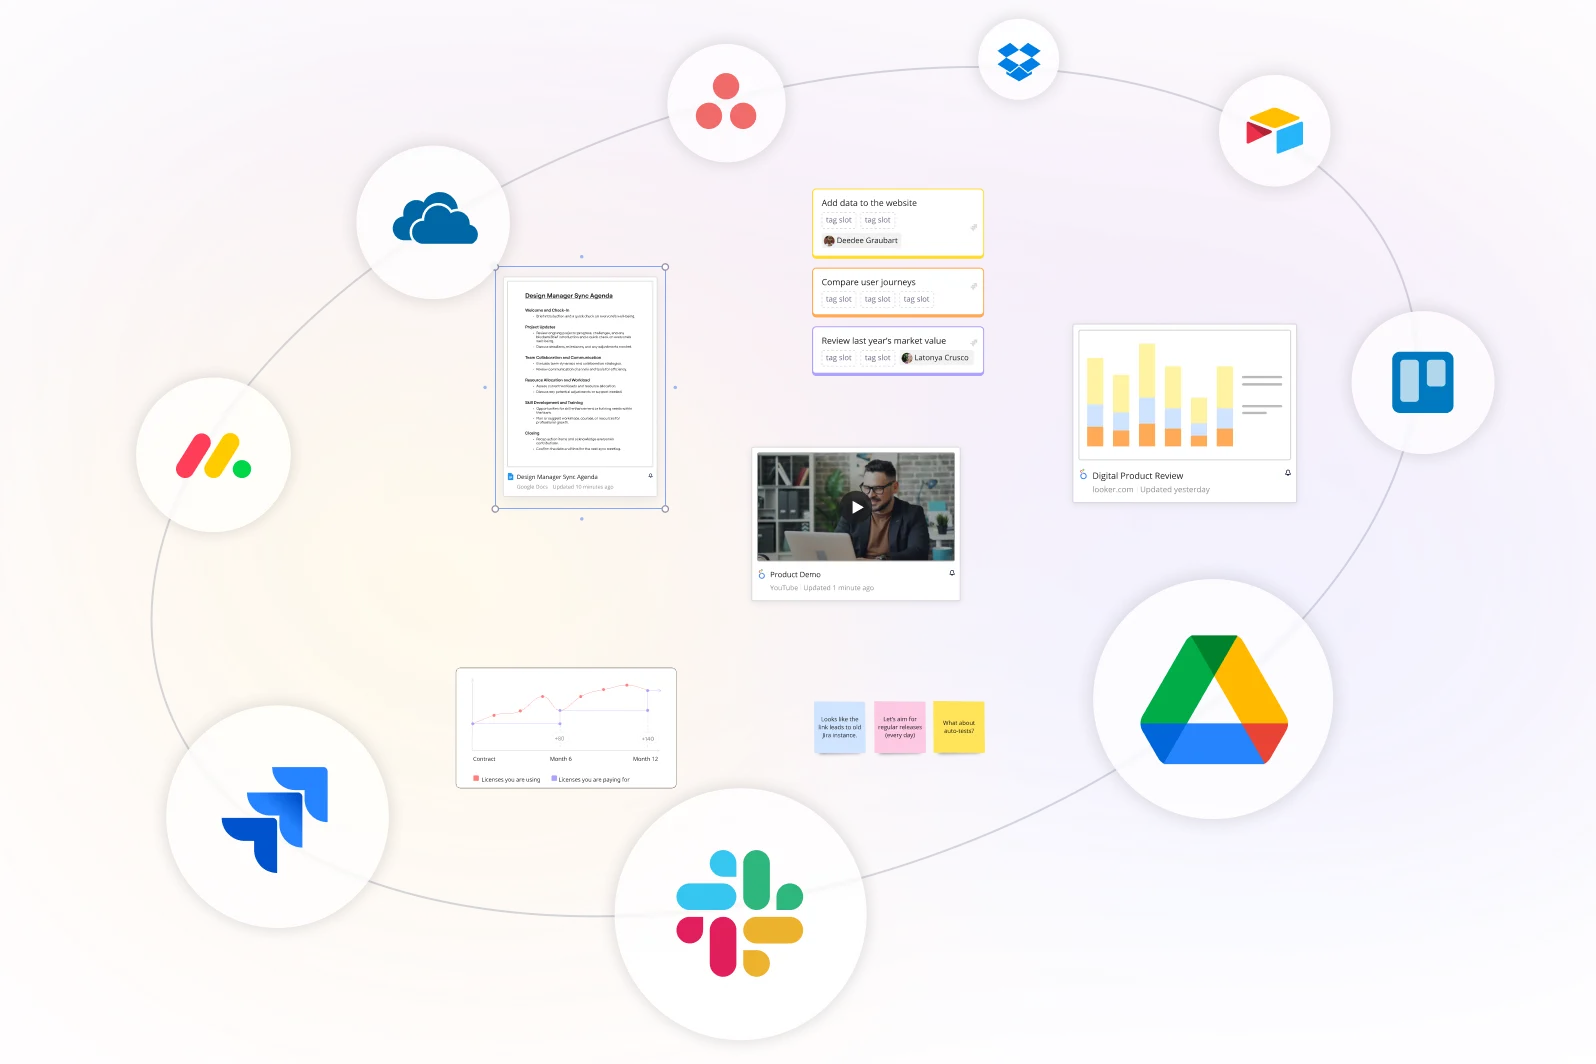
Integrated with your favorite tools
Related templates
How to create a data flow diagram with Miro
Your first step is to open Diagramming mode on a new board (or start from a data flow diagram example), and drag in industry-standard DFD symbols for processes, data stores, and external entities. Make sure you use our diagramming shapes library to represent each component with the right shape.
Then, you can use frames to scope subsystems, layers to separate current and future states, and auto-align tools to keep everything tidy. If you’re gathering inputs from a workshop, Miro AI can cluster sticky notes and convert them into a first pass of entities and processes, speeding up your process before refinement.
Use Miro’s smart connectors with arrows and auto-snapping to map directionality, then label each flow with the data moving between components. Apply colors and tags to group related streams, and use sticky notes or Miro Cards to capture assumptions and link out to other requirements.
If you’re working across tools, embed or link issues via the Jira/Asana integrations so your online data flow diagram stays connected to delivery.
Speed up changes with bulk select, style presets, and swap shape to update notation without redrawing your diagram. Click on the shapes to edit colors, fonts, and any other graphic elements of your data flow diagram.
Use smart distribution for even spacing, and duplicate patterns to scale repeating structures. Toggle layers to compare options side-by-side, and run Miro AI to summarize comments, spot duplicate flows, or propose missing connections.
Once your data flow diagram is ready, you’re ready to share it with your team.
Share a secure link with view, comment, or edit permissions, or embed the diagram directly into Confluence, Notion, or other tools to keep your documentation in sync. Your diagram can also be downloaded as an image or PDF. Use Talktrack to record a walkthrough for async stakeholders, or present live with full-screen and guided navigation.

The world's most innovative companies are collaborating in Miro, everyday
“With Miro, we went from project brief to in-market launch in 10 months. That usually takes 3 years at PepsiCo.”
Caroline de Diego
Senior Manager, Global Design & Marketing Innovation at PepsiCo

“Bringing everyone together to plan in Miro means the most impactful initiatives will happen at the right time.”
Lucy Starling
Product Operations Lead at Asos

“The team onboarded in 10 minutes to use Miro for workshops. Getting our organization to adopt this product was a no-brainer.”
Konrad Grzegory
Agile Transformation Lead at CD PROJEKT RED

“Miro templates helped us go from scratch to a full-fledged plan where we mapped activities, ideas, and dependencies.”
Marc Zukerman
Senior Director of Project Management at Hearst

“Miro allows all our teams to align themselves with certain tools and models: they work independently and create products that really meet our customers' needs.”
Luke Pittar
Sustainability Innovation & Design Coach at The Warehouse Group

“To be truly innovative, everyone needs to have a voice, and everyone needs to be able to iterate on each other’s ideas. Miro has made that possible for us.”
Brian Chiccotelli
Learning Experience Designer at HP

Users love Miro for end-to-end innovation. We're the G2 leader in visual collaboration platforms and are rated in the top 50 enterprise tools. Miro helps large companies get meaningful work done.
Top 50 Products for Enterprise
G2 reviews

Data flow diagram tool FAQs
What’s the difference between a data flow diagram and a process flow diagram?
A data flow diagram focuses on how data moves between systems and components, while a process flow diagram emphasizes the sequence of steps in a workflow. Essentially, DFDs show what data travels where, and process flows show how work gets done.
Where can I create a data flow diagram?
There are many tools you can use to create a data flow diagram, and it’s important to evaluate these against your needs. Miro’s data flow diagram maker allows you to:
Quickly diagram your systems with automated diagramming features
Use industry-standard shapes packs
Fully customize your data flow diagram according to your needs.
Try for yourself and see if it works for you.
Can I collaborate with my team when building a data flow diagram?
Yes! Collaboration is at the heart of Miro. Co-create a data flow diagram online with your entire team, comment directly on shapes, use voting to prioritize flows, and record Talktracks for asynchronous feedback. Everyone can contribute from anywhere, ensuring your diagram reflects the most accurate system knowledge.
Can I download or share my data flow diagram with others?
Yes. With Miro’s data flow diagram tool, you can share your work with others in two ways: exporting your diagram as an image or PDF, or sharing your board link with others. You can also embed your diagram into tools like Confluence or Notion to keep everything aligned.
Is Miro's data flow diagram maker free?
Yes! You can create and edit data flow diagrams for free using Miro’s free plan. This includes core diagramming features like smart connectors, industry-standard shapes, and access to data flow diagram templates. For more features, Miro’s paid plan offers more flexibility, such as Diagramming mode and integrations with over 160 apps and tools. Sign up for a free Miro account and start diagramming today.
Is Miro’s data flow diagram maker easy to use?
Yes, Miro’s data flow diagram creator is designed for intuitive, drag-and-drop use. You don’t need to be a designer -just start with a template or import existing documentation to get started. With smart connectors, auto-alignment, and Miro AI, teams can create professional diagrams quickly.
Does Miro have templates for data flow diagrams?
Miro offers data flow diagram templates and other ready-made resources to help teams get started faster. You can find thousands of customizable templates and data flow diagram examples in Miroverse, our community-driven library.
Can Miro AI help with data flow diagramming?
Miro AI can automatically cluster related ideas, summarize feedback, and suggest improvements to your diagrams. For example, after a brainstorming session, Miro AI can help turn sticky notes into structured data flow elements, saving time and ensuring no information gets lost in translation.
How much does it cost to use Miro AI features?
Miro AI is available on all plans through a credit system - from Free to Enterprise. Each AI action, such as generating diagrams, clustering insights, or summarizing content, uses one credit. The number of credits varies by plan, and credits are shared across all AI features. You can choose the AI credit bundle that best fits your team’s diagramming and collaboration needs.
Can Miro handle large-scale system diagrams?
Miro’s infinite canvas lets you visualize even the most complex architectures without limits. You can layer multiple DFD levels and link related diagrams together, making it ideal for large engineering, IT, and product teams managing enterprise-scale systems.
Can Miro’s data flow diagram generator be customized to suit my workflow?
Miro is fully customizable. You can create your own templates, import custom shapes, or use Miro Blueprints to standardize your system-mapping workflows across teams.
How do I know my team’s data and diagrams are secure in Miro?
Miro is built with enterprise-grade security to protect your data and designs. You have full control over access and permissions, ensuring that only approved collaborators can view or edit your diagrams. With encryption, advanced admin settings, and strict compliance standards, you can map even the most complex data flows confidently, knowing your information stays secure.