
Table of contents
Table of contents
What is a burndown chart? The ultimate guide
Page Summary
To help you avoid frustrating surprises, our guide covers:
What a burndown chart is and how it works
The key components every chart should include
Different types of burndown charts
How burndown charts compare to other types of charts
How to create and use burndown charts effectively
Real-world examples and templates to help you get started
Try Miro now
Join thousands of teams using Miro to do their best work yet.
So, what is a burndown chart?
A burndown chart is a graphical tool used to track project progress. It displays the work completed and what remains to be done.
Teams use these charts to ensure timely delivery of projects by visualizing the pace of work and identifying any slowdowns quickly. They’re an effective way to stay on top of a project's timeline.
Why is a burndown chart important?
Burndown charts originated in the Agile framework to help teams monitor progress. They visualize the work left and the time remaining in a sprint or project.
Imagine a graph with time on the horizontal axis and work on the vertical axis. The line slopes downward, showing decreasing work over time.
For teams, a burndown chart is invaluable. It provides real-time insight into progress and potential bottlenecks. Knowing where you stand helps make timely adjustments.
The beauty of a burndown chart lies in its simplicity. It highlights trends that align team efforts with sprint goals, improving communication among team members.
With data-driven decisions, teams remain proactive, addressing challenges before they spiral out of control. A burndown chart also fosters a sense of transparency and accountability within the group.
Why use a burndown chart?
A burndown chart gives your team a clear, visual snapshot of what’s left to do, helping you stay on track throughout a sprint or project. It makes it easy to see progress at a glance, identify tasks that need attention, and adjust workloads as needed. By providing quick, actionable insights, it keeps daily work organized and ensures everyone knows what to prioritize next.
How does a burndown chart work?
A burndown chart estimates the amount of work needed to be completed, and maps it against the time it takes to complete the work. The objective is to accurately depict time allocations and plan for resources needed in the future.
Burndown charts use ‘user stories’ to visualize progress towards a goal. Remaining work elements are plotted against time to accurately track progress. When completed, user stories are subtracted from the total remaining work on the vertical axis, causing the burndown line to drop.
Burndown chart components
Several elements make up a burndown chart. Understanding each helps in interpreting the chart correctly.
Here's what you typically find on a burndown chart:
Time: Usually plotted on the horizontal axis. It represents the project timeline or sprint duration.
Work remaining: Shown on the vertical axis. It measures the amount of work left to complete.
Ideal work line: This line moves at a constant slope, indicating the perfect work pace.
Actual work line: It shows real progress, deviating from the ideal line.
Story points: These estimate the relative effort required to complete tasks. Usually represented on the vertical axis.
Together, these elements give a clear picture of project health. They help teams visualize current status versus planned progress, making it easier to strategize for on-time delivery.
Types of burndown chart
A burndown chart is a versatile tool that can be applied to various levels of Agile project management and Scrum frameworks. Here are some of the most common types:
Sprint burndown chart
A sprint burndown chart tracks progress within a single sprint which is typically 1-4 weeks. It will show the remaining work for that specific sprint, helping teams monitor progress and ensure they stay on track. The horizontal axis shows the days in the spring and the vertical axis shows remaining work.
Release burndown chart
A release burndown chart is used to track the progress of a single release which often has multiple sprints. As with all types of burndown chart, a release burndown chart shows progress in completing user stories and epics planned for specific release.
Product burndown chart
A product burndown chart tracks the progress of an entire product backlog or large body of work, such as an epic. They are sometimes referred to as epic burndown charts. Product burndown charts offer a strategic, long-term view of a project, helping teams align on overall progress.
Burndown chart vs. Gantt charts
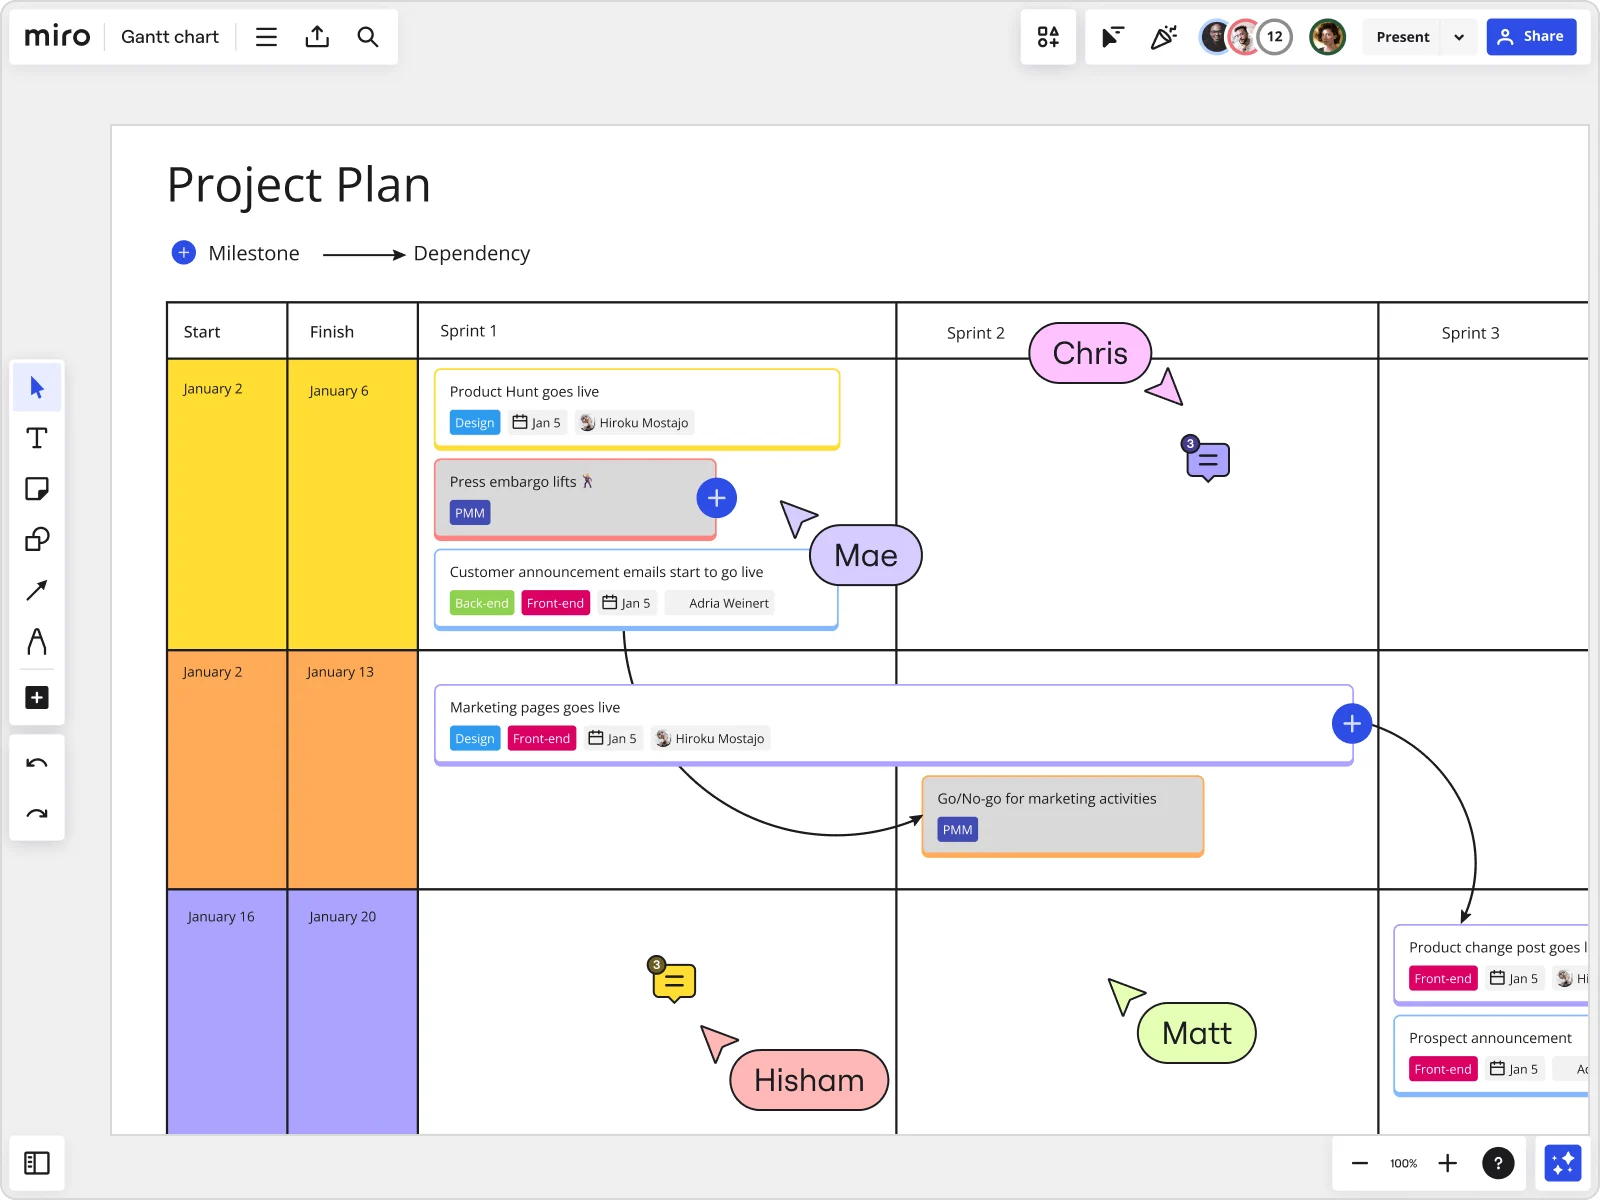
If you're wondering, "How does a burndown chart differ from a Gantt chart?" We've got you covered. Gantt charts and burndown charts both serve in project management, but they cater to different needs.
Gantt charts offer a detailed timeline, mapping out dependencies and phases across a project. They're great for long-term planning.
Agile burndown charts, on the other hand, track how much work gets done over time. They provide a quick view of what's done versus what's left, without the detailed task breakdown. For Agile teams, this simple snapshot can be incredibly efficient.
While Gantt charts provide deep planning and mapping, burndown charts provide real-time updates and transparency. The choice between them often depends on a team's immediate needs and project scope. Each has its place in a well-rounded project management toolkit.
How to create a burndown chart
A burndown chart visually tracks work progress in Agile projects and keeps teams on target. By breaking down the process into clear steps, teams can avoid common pitfalls like unclear workloads, shifting priorities, or missed deadlines.
Follow these steps to create one:
1. Define the work scope
List all tasks or user stories for the sprint or project. Estimate the effort for each task using a metric like story points or hours. This creates a clear view of the total workload. A well-defined scope also prevents scope creep, ensuring the chart reflects realistic expectations.
2. Set the timeline
Determine the duration of the sprint or project. Mark the timeline on the X-axis of the chart, with each increment representing a day or iteration. Clear timelines help the team pace itself, keeping deadlines visible and reducing the risk of last-minute rushes.
3. Plot the total work
Calculate the total effort required to complete all tasks. Plot this value as the starting point at the top of the Y-axis. This provides a baseline for tracking progress, making it obvious whether work is burning down as expected.
4. Draw the ideal burndown line
Create a straight line from the total work at the start of the sprint to zero at the end. Use this line as the benchmark for tracking progress. This line shows the perfect world scenario - if everything went exactly to plan.
5. Track daily progress
Update the chart daily by subtracting completed tasks from the total effort. Plot the remaining work to create the actual progress line. This makes progress visible at a glance, helping your team address issues before they snowball.
6. Analyze trends
Compare the actual progress line to the ideal line. Identify whether the team is ahead, behind, or on track with the planned workload. Trends can reveal hidden problems, like recurring bottlenecks, under-estimated tasks, or a lack of resources. The data sourced from this analysis will help teams to improve future planning.
7. Share and adjust
Share the burndown chart in daily stand-ups to keep the team informed. Discuss blockers or delays and adjust plans as needed to stay aligned with the sprint goals. Making the chart a shared tool builds accountability, transparency, and trust amongst your team.
How to use burndown charts
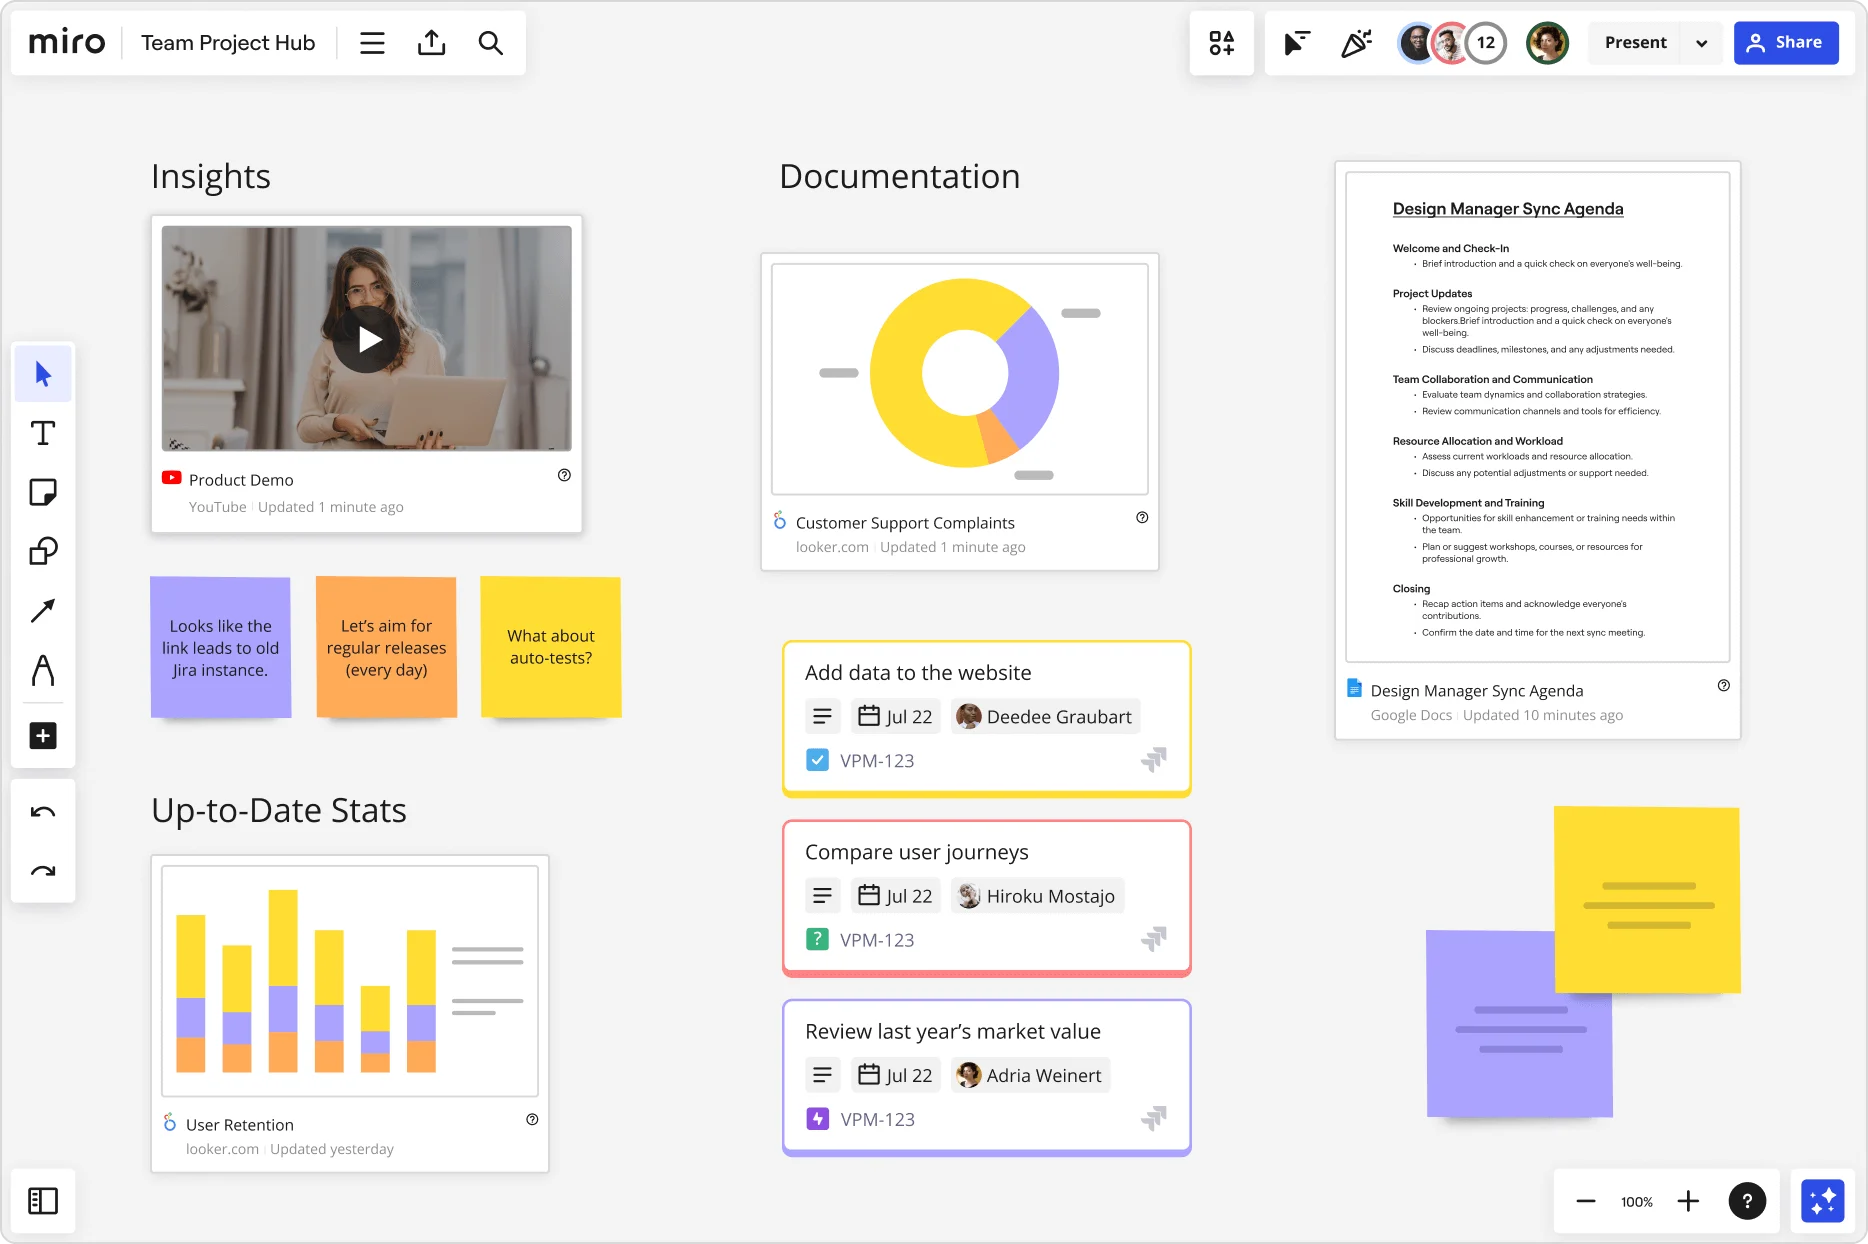
Whether you create a burndown chart in Scrum, Agile, Excel, or something else, it’s critical that you know how to use them. At Miro, we can help with this. From burndown chart examples in the Miroverse community to burndown chart templates on our infinite canvas, you’ve always got a good starting point.
Burndown charts in Scrum
In Scrum frameworks, a burndown chart can help teams manage workload and deliver value to stakeholders. In most Scrum teams, burndown charts are used to track progress of the sprint backlog, ensuring the team is on track to meet the sprint goal while identifying risks that may impact delivery.
Burndown charts in Agile
In Agile project management, burndown charts are a key metric for tracking team progress and identifying any potential issues early in the process. Agile teams can monitor the completion of user stories and tasks throughout the sprint, compare actual progress against the ideal progress, and establish scope creep.
How CD PROJEKT RED keeps complex projects on track
With 27 teams across multiple studios, CD PROJEKT RED needed a way to coordinate hundreds of developers, designers, and producers while shifting from waterfall to Agile. Their previous tools weren’t flexible enough for milestone planning or large-scale collaboration.
With Miro, the team restructured its nine-week milestone planning into a simple three-day cycle: strategy alignment, team road mapping, and dependency solving. Shared boards gave everyone visibility. The Miro–Jira integration reduced manual work and kept planning sessions fast and engaging.
This led to:
Cut milestone planning meetings by one-third
Saved 7 working hours per iteration
Reduced strategic alignment from 9 hours to just 2
Improved visibility between development cycles
Resolved dependencies faster across teams
“We needed a tool to help us collaborate more efficiently with hundreds of people at one time. Getting our organization to adopt Miro was a no-brainer.”
Konrad Grzegory, Agile Transformation Lead, CD PROJEKT RED
Read the full case study here.
Run Agile release planning in Miro
Ready to take Agile release planning to the next level? Miro's intuitive and powerful Agile tools make it easy for teams to come together and create their best work. Seamlessly run everything from Sprint planning to retrospectives — and more.
Sign up to get started.
Burndown chart FAQs
How often should a burndown chart be updated?
Ideally, a burndown chart should be updated every day or as progress is made, depending on your project. This frequent refresh ensures the chart accurately reflects the real state of work, helping you spot deviations early so you can mitigate against any problems.
How does Miro help my team collaborate on burndown charts?
Miro makes it easy for teams to collaborate on burndown charts together, whether you’re building a sprint burndown chart for Scrum or an Agile burndown chart for longer projects. Our shared canvas allows for both real-time and asynchronous updates, where teams can co-create with comments, mentions, cursor tracking, and Talktrack recordings.
Where can I find burndown chart examples and templates?
The Miroverse is your go-to place for examples and templates. Here, you’ll find thousands of templates created by other industry professionals that you can tailor to suit your organization’s needs. You can also join Miro’s forum to connect with practitioners, share tips, and discover best practices.
Can I use Miro AI to help me create burndown charts?
Yes, Miro AI can help you create burndown charts quicker by clustering, summarizing, or generating insights based on your backlog items, sticky notes, or board metrics.
Can Miro handle large projects with multiple burndown charts?
Yes, Miro’s scalability and infinite canvas means you can manage multiple burndown charts across sprints, releases, or entire portfolios. Our integrations with Jira, Asana, and 160 other tools and apps also means your burndown chart stays synchronized with live data, so progress can be tracked at any scale.
Can I customize burndown charts in Miro?
Yes. You can design burndown charts to fit your process, create reusable templates for your team, or set up Miro Blueprints for scaled workflows.
Author: Miro Team
Last update: October 21, 2025